Overcoming Indigenous Disadvantage: Key Indicators 2020
The Overcoming Indigenous Disadvantage report measures the wellbeing of Aboriginal and Torres Strait Islander people.
This comprehensive report card measures where things have improved (or not) against 52 indicators across a range of areas including governance, leadership and culture, early childhood, education, economic participation, health, home environment and safe and supportive communities. The report includes case studies on governance, with a specific focus on identifying arrangements that support shared decision-making between Aboriginal and Torres Strait Islander people and Australian governments.
This report was produced in consultation with all Australian governments, the Coalition of Aboriginal and Torres Strait Islander Peak Organisations and other Aboriginal and Torres Strait Islander people and organisations.
The 2020 report was released on 3 December 2020.
Please note: Aboriginal and Torres Strait Islander people are advised that this website may contain names, images and voices of deceased people. It may also link to other websites which contain names, images and voices of deceased people.
- At a glance
- Overview
- Report
- Fact sheet
Media release
Overcoming Indigenous Disadvantage 2020
The 2020 Overcoming Indigenous Disadvantage (OID) report shows mixed outcomes for Aboriginal and Torres Strait Islander people.
Four years on from the previous Report there continues to be improvement in many areas of early child development, economic participation and some aspects of health and education.
But areas such as justice and mental health remain concerning, with increases in the rates of imprisonment, suicide and self-harm.
If change is to occur these outcomes need to be understood in context; recognising the strengths of Aboriginal and Torres Strait Islander people that contribute to their wellbeing, as well as the structural and systemic barriers that can undermine or erode their wellbeing.
“Poorer outcomes are not due to people being Aboriginal or Torres Strait Islander, but can be attributed to the additional personal challenges and structural barriers faced by many Aboriginal and Torres Strait Islander people,” Chair Michael Brennan said.
Policies and programs may appear neutral on the surface, but can operate in an uneven or unfair manner that is detrimental to Aboriginal and Torres Strait Islander people.
“Removing these structural barriers is critical if the wellbeing of Aboriginal and Torres Strait Islander people is to improve,” Mr Brennan said.
Shared decision-making — the focus of the case studies in this Report — is a common element in approaches that appear successful in improving outcomes.
“Aboriginal and Torres Strait Islander people’s participation in decisions on policy, program and service design and delivery is important to drive real change on the ground,” said Commissioner Romlie Mokak.
With the National Agreement on Closing the Gap in place, the Report can assist those in policy and program design and delivery and should be compulsory reading for anyone interested in the wellbeing of Aboriginal and Torres Strait Islander people.
It is the most comprehensive report on the wellbeing of Aboriginal and Torres Strait Islander people produced in Australia.
The Report is produced by the Productivity Commission for the Steering Committee for the Review of Government Service Provision, and is the eighth in the series.
The 2020 OID report, overview and short video can be found at: www.pc.gov.au/oid2020
Key points
- This report measures the wellbeing of Aboriginal and Torres Strait Islander people. It provides comprehensive data across a range of outcome areas, along with supporting material on the strengths of Aboriginal and Torres Strait Islander people, and the structural and systemic barriers that need to be addressed if outcomes are to further improve.
- In many areas outcomes have improved for Aboriginal and Torres Strait Islander people.
- Mortality rates for children improved between 1998 and 2018, particularly for 0<1 year olds, whose mortality rates more than halved (from 13 to 5 deaths per 1000 live births).
- Education improvements included increases in the proportion of 20–24 year olds completing year 12 or above (from 2008 to 2018‑19) and the proportion of 20–64 year olds with or working towards post‑school qualifications (almost doubling from 2002 to 2018‑19).
- From 2014 to 2018, more people in the general community felt it was important to know about Aboriginal and Torres Strait Islander histories and cultures and more people rated their level of knowledge of both as high.
- But in some areas outcomes have not improved for Aboriginal and Torres Strait Islander people.
- Rates of children in out-of-home care have almost tripled in the past 15 years (60 per 1000 children in 2018-19).
- The proportion of adults reporting high levels of psychological distress increased from 27 per cent in 2004-05 to 31 per cent in 2018-19, and the rate of deaths from suicide and self-harm increased by 40 per cent over the decade to 2018.
- The adult imprisonment rate increased 72 per cent between 2000 and 2019, and whilst the youth detention rate has decreased it is still 22 times the rate for non-Indigenous youth.
- When outcomes have not improved they need to be understood with reference to the personal challenges and systemic and structural barriers that many Aboriginal and Torres Strait Islander people have experienced and continue to face.
- Aboriginal and Torres Strait Islander people have a higher prevalence of the personal risk factors associated with poorer outcomes and are more likely to have multiple risk factors.
- Aboriginal and Torres Strait Islander people are often disproportionally affected by structural barriers due to their particular circumstances or the disadvantage they experience.
- Connection to culture is a key to many Aboriginal and Torres Strait Islander people’s identity and strength. These cultures are a foundation on which wellbeing can continue to be built.
- Common characteristics of approaches that appear to be successful in improving outcomes for Aboriginal and Torres Strait Islander people include:
- Enabling Aboriginal and Torres Strait Islander people to share in decision‑making on things that affect them.
- Addressing laws, policies, and practices that operate to the detriment of Aboriginal and Torres Strait Islander people.
- Ongoing government investment, collaboration and coordination.
- Ensuring access to effective culturally safe services, at the right time and suited to the local context.
- Addressing racism and discrimination in the Australian community, through structural changes, and building knowledge and education.
Transcript of video
It’s been four years since the last Overcoming Indigenous Disadvantage Report.
It covers early child development, health, housing, education, economic participation, safe communities and governance, leadership and culture.
This report produced by the Productivity Commission is THE most comprehensive report on the wellbeing of Aboriginal and Torres Strait Islander people.
It shows where things are getting better, worse where there’s been no change, or where we need more information or better information to assess how things are tracking.
But the outcomes in this report need to be understood in context.
This means understanding our shared history since colonisation and the impacts on Aboriginal and Torres Strait Islander people today.
This edition of the report not only gives us a high level picture of the wellbeing of Aboriginal and Torres Strait Islander people but it also tells us where the barriers for positive change lie and some of the things that might work to overcome these.
One thing that is key is shared decision-making between Aboriginal and Torres Strait Islander people and governments – and this is the focus of the case studies in this report and acknowledges that governments, even with good intentions, are not those best placed to understand what works to improve outcomes for Aboriginal and Torres Strait Islander people.
This is now the 8th edition of the Overcoming Indigenous Disadvantage report.
While outcomes have improved in some areas since our first edition nearly 20 years ago, there are some areas where we are yet to see any improvement.
This report demonstrates that a better understanding of Aboriginal and Torres Strait Islander people is needed if we are to improve outcomes.
We hope that this report will provide a useful tool to Aboriginal and Torres Strait Islander people and for those that work in policy and program areas to facilitate this change.
Download the Overview booklet
- Overview booklet - Overcoming Indigenous Disadvantage: Key Indicators 2020 (PDF - 5150 Kb)
- Overview booklet - Overcoming Indigenous Disadvantage: Key Indicators 2020 (Word - 933 Kb)
The Overview summarises the key messages. More detailed information can be found in the main report. Links to the relevant page in the main report are provided below for each indicator.
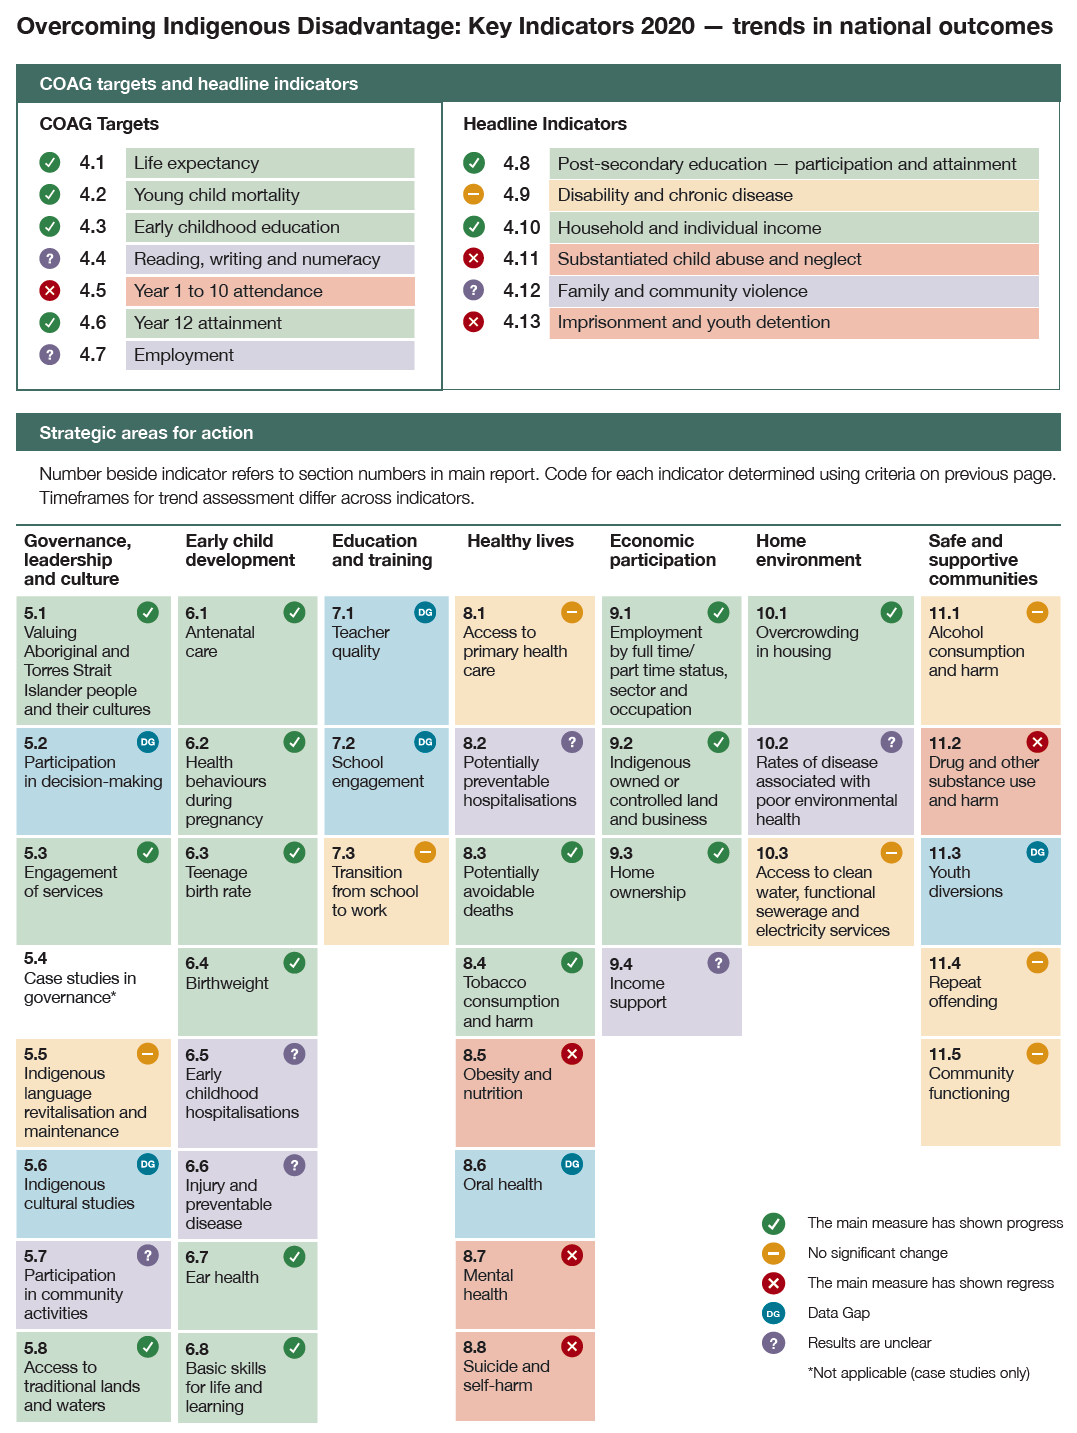
Indicator summary
Legend
![]() The main measure has shown progress
The main measure has shown progress
![]() No significant change
No significant change
![]() The main measure has shown regress
The main measure has shown regress
![]() Data Gap
Data Gap
![]() Results are unclear
Results are unclear
Click on the headings below to reveal summaries of the indicators and links to their respective section in the full report.
COAG targets
The seven COAG targets are high level social and economic outcomes that must improve in order to achieve the priority outcomes. These indicators are often closely inter-related and positive change will generally require action across a range of areas. In addition, most of these high-level indicators are likely to take some time to improve, even if effective policies are implemented. Please note that the trend result is not an assessment of whether the target will be met.
4.1 Life expectancy
Aboriginal and Torres Strait Islander boys born in 2015–2017 are expected to live to 71.6 years and girls to 75.6 years. This is 4.1 years longer than for boys and 2.5 years longer for girls born 10 years earlier (2005–2007), but changes were not statistically significant for girls.
More on page 4.4 (PDF - 24.0 MB)4.2 Young child mortality
From 1998 to 2018, there was a significant decline in mortality rates for Aboriginal and Torres Strait Islander children aged 0–4 years (from 217 to 141 deaths per 100 000 population), with the greatest decrease in the infant (0–<1 year) mortality rate (from 13 to 5 deaths per 1000 live births).
More on page 4.13 (PDF - 24.0 MB)4.3 Early childhood education
In 2019, for Aboriginal and Torres Strait Islander children in the year before full time schooling:
- 92 per cent were enrolled in preschool, an increase since 2016
- 94 per cent were attending preschool, similar to 2016.
4.4 Reading, writing and numeracy
Results for this indicator have fluctuated over time with no clear trend. Comparing 2008 and 2019, the proportion of Aboriginal and Torres Strait Islander students achieving national minimum standards increased for Years 3 and 5 for reading, and for Years 5 and 9 for numeracy. However, volatility in the data means conclusions drawn from comparisons should not be interpreted as consistent improvement over time.
More on page 4.31 (PDF - 24.0 MB)4.5 Year 1 to 10 attendance
In 2019, the overall attendance rate for Aboriginal and Torres Strait Islander students was 82 per cent, a decrease from 84 per cent in 2014.
The attendance rate for non-Indigenous students was 92 per cent in 2019.
More on page 4.43 (PDF - 24.0 MB)4.6 Year 12 attainment
The proportion of Aboriginal and Torres Strait Islander 20–24 year olds completing year 12 or equivalent or above increased from 45 per cent in 2008 to 66 per cent in 2018-19. For non-Indigenous people, the proportion remained relatively unchanged (90 per cent in 2017-18).
More on page 4.54 (PDF - 24.0 MB)4.7 Employment
Data for this indicator are difficult to interpret due to a number of changes including to the Community Development Employment Projects (CDEP) program, now the Community Development Program (CDP). The employment rate for Aboriginal and Torres Strait Islander 15–64 year olds increased from 38 per cent in 1994 to 54 per cent in 2008, before decreasing to 49 per cent in 2018-19 (similar to 2012-13), partly driven by changes to the CDEP program.
More on page 4.66 (PDF - 24.0 MB)Headline indicators
The six headline indicators are high level social and economic outcomes that must improve in order to achieve the priority outcomes. These indicators are often closely inter-related and positive change will generally require action across a range of areas. In addition, most of these high-level indicators are likely to take some time to improve, even if effective policies are implemented.
4.8 Post-secondary education – participation and attainment
The proportion of Aboriginal and Torres Strait Islander 20–64 year olds with a Certificate level III or above or studying increased from 26 per cent in 2002 to 50 per cent in 2018-19.
The gap between Aboriginal and Torres Strait Islander people and non-Indigenous people remained steady over the period at about 25 percentage points.
More on page 4.75 (PDF - 24.0 MB)4.9 Disability and chronic disease
In 2015, the rate of disability among Aboriginal and Torres Strait Islander people was 24 per cent, little changed from 21 per cent in 2009. Chronic diseases can result in disability, and vice versa.
More on page 4.87 (PDF - 24.0 MB)4.10 Household and individual income
The median equivalised gross weekly household (EGWH) income for Aboriginal and Torres Strait Islander people was $553 in 2018-19.
Due to changes in data collection methodologies we cannot compare 2018-19 EGWH income with historical data. However, between 2002 and 2014-15 Aboriginal and Torres Strait Islander people’s real EGWH increased by about 30 per cent.
More on page 4.99 (PDF - 24.0 MB)4.11 Substantiated child abuse and neglect
Child protection substantiations for Aboriginal and Torres Strait Islander children increased from 28 per 1000 children in 2009-10 to 42 per 1000 children in 2016-17, before decreasing to 38 per 1000 children in 2018-19.
The rate of Aboriginal and Torres Strait Islander children in out-of-home care increased from 21 to 60 per 1000 children over the 14 years to 2018-19, while the proportion placed in accordance with the Aboriginal Child Placement Principle decreased.
More on page 4.110 (PDF - 24.0 MB)4.12 Family and community violence
The 2018-19 collection was the first time these data were collected as part of the ABS National Aboriginal and Torres Strait Islander Health Survey and are not comparable to data collected in ABS National Aboriginal and Torres Strait Islander Social Surveys.
In 2018-19, about 16 per cent of Aboriginal and Torres Strait people aged 15 years or over reported being a victim of physical or threatened harm in the past 12 months.
This proportion is about three times the rate for the total population aged 15 years or over.
More on page 4.124 (PDF - 24.0 MB)4.13 Imprisonment and juvenile detention
From 2000 to 2019, the imprisonment rate for Aboriginal and Torres Strait Islander adults increased 72 per cent.
The daily average detention rate for Aboriginal and Torres Strait Islander youth decreased from 2007-08 to 2018-19 (from 409 to 336 per 100 000 10–17 year olds), but remains about 22 times the rate for non-Indigenous youth.
More on page 4.136 (PDF - 24.0 MB)Governance, leadership and culture
Effective governance and leadership, and recognition of cultures, are essential to the wellbeing of Aboriginal and Torres Strait Islander people. These influence most indicators in the framework that underpin this Report. Governance refers to the way the members of a group or community organise themselves to make decisions that affect themselves and others. Central to the development of strong governance is leadership, and there are specific cultural aspects to Aboriginal and Torres Strait Islander leadership. Cultures include the diverse Aboriginal and Torres Strait Islander nations and peoples, each with distinct cultural norms, laws, languages and identities that are dynamic in nature.
5.1 Valuing Aboriginal and Torres Strait Islander people and their cultures
In 2018, more than 8 in 10 people in the general community felt it was important for all Australians to know about Aboriginal and Torres Strait Islander cultures and histories and about two in five rated their level of knowledge of Aboriginal and Torres Strait Islander cultures and histories as high — increases from 2014.
Over this period the proportions of people perceiving levels of trust as high have remained relatively unchanged.
More on page 5.3 (PDF - 4.7 MB)5.2 Participation in decision-making
There are no data available on Aboriginal and Torres Strait Islander people wanting to, and feeling that they can, participate in decision-making that is important to them. Available data on the participation of Aboriginal and Torres Strait Islander people show they remain underrepresented in the Parliament of Australia and in all State and Territory parliaments. As of May 2020, parity across all nine jurisdictions would be achieved with 15 additional Aboriginal and Torres Strait Islander parliamentarians.
More on page 5.11 (PDF - 4.7 MB)5.3 Engagement of services
The proportion of Aboriginal and Torres Strait Islander people aged 15 years or over who reported problems accessing services in the previous 12 months decreased from 30 per cent in 2008 to 24 per cent in 2014-15. Difficulty with access was higher in remote areas compared to non-remote areas (33 per cent compared to 22 per cent).
More on page 5.19 (PDF - 4.7 MB)5.4 Case studies in governance
There is no trend category for this indicator, which is based on qualitative case studies. Governance arrangements that empower Aboriginal and Torres Strait Islander people to achieve the things that matter to them, ensure they are able to participate in shared decision-making alongside governments. Case studies in this section highlight that this works best when structures, rules and laws:
- provide Aboriginal and Torres Strait Islander people with decision-making authority
- promote Aboriginal and Torres Strait Islander cultural frameworks, processes, context and time frames
- recognise power inequalities, and share power, through mechanisms that are transparent
- ensure Aboriginal and Torres Strait Islander people can choose their representatives, and these representatives have the resources and support that they need
- define desired outcomes, the steps to achieving them and the roles and responsibilities of participants, along with their mutual accountabilities.
5.5 Indigenous language revitalisation and maintenance
In 2014-15, similar to 2008, for Aboriginal and Torres Strait Islander people aged 3 years or over:
- 11 per cent were learning an Indigenous language, with the proportion highest for the youngest age group (19 per cent for 3–14 year olds)
- 16 per cent spoke an Indigenous language, with the proportion highest in remote areas (50 per cent).
5.6 Indigenous cultural studies
There is no main measure for this indicator. Data are reported on supplementary measures for students taught about Indigenous cultures as part of their studies and the proportion of Aboriginal and Torres Strait Islander school staff. In 2014-15, consistent with 2008, about 70 per cent of Aboriginal and Torres Strait Islander 5–14 year olds reported being taught about Indigenous cultures at school. (No data are available for non-Indigenous people.)
More on page 5.50 (PDF - 4.7 MB)5.7 Participation in community activities
Results for this indicator are unclear as one measure (participation in sport and recreational activities) has shown progress while the other measure (participation in cultural events) has declined. Between 2002 and 2014-15, the proportion of Aboriginal and Torres Strait Islander people aged 15 years or over attending cultural events in the past 12 months decreased (from 68 to 63 per cent), while the proportion participating in sport and recreational activities increased (from 49 to 59 per cent).
More on page 5.56 (PDF - 4.7 MB)5.8 Access to traditional lands and waters
In 2018-19, the proportion of Aboriginal and Torres Strait Islander adults that recognised traditional lands was 74 per cent. Recognition was higher in remote areas (90 per cent) compared to non-remote areas (71 per cent).
For Aboriginal and Torres Strait Islander people aged 15 years and over the proportion increased from 2002 (70 per cent) to 2012-13 (74 per cent), where it remained in 2014-15 (data were not available for people aged less than 18 years for 2018-19).
More on page 5.63 (PDF - 4.7 MB)Early child development
A good start can help children to thrive and lead happy and healthy lives into adulthood. Addressing challenges in early childhood, including before children are born, can reduce the development of problems that would prevent them achieving their full potential. The indicators in this strategic area focus on the early drivers of long-term wellbeing which contribute to overcoming disadvantage.
6.1 Antenatal care
The proportion of Aboriginal and Torres Strait Islander women who gave birth and attended at least one antenatal visit in the first trimester of pregnancy, increased from 50 per cent in 2011 to 66 per cent in 2018.
More on page 6.3 (PDF - 5.0 MB)6.2 Health behaviours during pregnancy
The proportion of Aboriginal and Torres Strait Islander mothers who smoked during pregnancy decreased from 52 per cent in 2009 to 44 per cent in 2018.
More on page 6.11 (PDF - 5.0 MB)6.3 Teenage birth rate
The Aboriginal and Torres Strait Islander teenage birth rate is at its lowest level since reporting began in 2004, with a rate of 48 births per 1000 women aged 15–19 years in 2018. The non-Indigenous teenage birth rate is also at its lowest level over this period, with a rate of 7 births per 1000 women of this age in 2018.
More on page 6.23 (PDF - 5.0 MB)6.4 Birthweight
Nationally, the proportion of Aboriginal and Torres Strait Islander mothers who had low birthweight babies decreased from 11 per cent in 2007 to 10 per cent in 2018.
More on page 6.32 (PDF - 5.0 MB)6.5 Early childhood hospitalisations
Results for this indicator are difficult to interpret, as an increase in hospitalisations may indicate improved access to services rather than an increase in prevalence of underlying conditions. It is important to consider the leading causes, duration and frequency of children’s hospitalisations. Nationally in 2018-19, there were about 3 hospitalisations for every 10 Aboriginal and Torres Strait Islander 0–4 year olds. This rate has increased by almost 40 per cent over the past decade.
More on page 6.40 (PDF - 5.0 MB)6.6 Injury and preventable disease
An increase in hospitalisations may indicate improved access to services rather than an increase in injuries and preventable diseases. This combined with no change in the death rate make the results difficult to interpret. Between 2010-11 and 2018-19, potentially preventable hospitalisation rates increased 25 per cent for Aboriginal and Torres Strait Islander 0–4 year olds.
From 2009–2013 to 2014–2018 (for NSW, Queensland, WA, SA and the NT combined), the potentially avoidable death rate did not change substantially.
More on page 6.48 (PDF - 5.0 MB)6.7 Ear health
The proportion of Aboriginal and Torres Strait Islander 0–14 year olds with a self reported hearing condition decreased from 11 per cent in 2001 to 7 per cent in 2018-19. The rate for non-Indigenous children in 2017-18 was 3 per cent.
In 2018-19, the hospitalisation rate for Aboriginal and Torres Strait Islander 0–14 year olds for ear and hearing problems was 9 per 1000 population, compared to 6 per 1000 population for non-Indigenous children.
More on page 6.58 (PDF - 5.0 MB)6.8 Basic skills for life and learning
From 2009 to 2018, the proportions of Aboriginal and Torres Strait Islander children classified as developmentally ‘on track’ increased in each domain of the Australian Early Development Census (from between 47–60 to 60–65 per cent). These proportions remain lower than those for non-Indigenous children (between 77–86 per cent) but the gap has narrowed in each domain since 2009.
More on page 6.66 (PDF - 5.0 MB)Education and training
Education is a life-long activity, beginning with learning and development in the home and in communities and continuing through to more formal settings of school education, vocational education and training and higher education. Education and training can help strengthen communities and regions both economically and socially, and there are strong links between higher levels of education and improved health outcomes.
7.1 Teacher quality
There is currently no nationally-agreed measure of teacher quality. The More Aboriginal and Torres Strait Islander Teachers Initiative (MATSITI) found that there were 3100 Aboriginal and Torres Strait Islander school teachers nationally in 2015, a net increase of 439 teachers from 2012. Of these teachers, 83 per cent were classroom teachers, 7 per cent were deputy principals and 3 per cent were principals.
More on page 7.3 (PDF - 1.5 MB)7.2 School engagement
There is currently no nationally-agreed definition of school engagement and hence no agreed measure. Aspects measured in this Report include attendance (aspect of behavioural engagement) in section 4.5 and sense of belonging (aspect of emotional engagement). Data show that Aboriginal and Torres Strait Islander students’ and non-Indigenous students’ sense of belonging at school has been decreasing since 2003.
More on page 7.11 (PDF - 1.5 MB)7.3 Transition from school to work
The proportion of Aboriginal and Torres Strait Islander 17–24 year olds participating in post-school education, training or employment was 36 per cent in 2018-19, similar to 2002.
More on page 7.21 (PDF - 1.5 MB)Healthy lives
Aboriginal and Torres Strait Islander people’s understanding of health is holistic and encompasses physical, mental, cultural and spiritual health. Good health and wellbeing depends on the network of individuals, family, kin, and community, and it recognises an individual’s connection to land (which is central to wellbeing), culture, spirituality and ancestors. If the harmony of these interrelations is disrupted, it can lead to Aboriginal and Torres Strait Islander people’s ill health.
Health outcomes directly affect the quality and length of people’s lives, including their ability to socialise with family and friends, to participate in the community and to work and earn an income. Physical health outcomes reflect such things as a healthy living environment and access to and use of health and community services. Mental health outcomes are related to a complex range of medical issues, historical and lifestyle factors, and the stressors associated with entrenched disadvantage and drug and substance misuse.
8.1 Access to primary health care
The proportion of Aboriginal and Torres Strait Islander people 15 years or over reporting their health as excellent or very good in 2018-19 (45 per cent) is largely unchanged from 2002 (44 per cent) following a decrease in 2012-13 (39 per cent).
The proportion of Aboriginal and Torres Strait Islander adults in 2018-19 reporting not seeing a doctor in the previous 12 months when needed (19 per cent) is largely unchanged from 2012-13.
More on page 8.4 (PDF - 5.5 MB)8.2 Potentially preventable hospitalisations
Results for this indicator are difficult to interpret. These hospitalisations are a proxy measure as increasing hospitalisations for potentially preventable conditions may represent a lack of access to primary care but could also reflect better access to hospital services. For Aboriginal and Torres Strait Islander people, hospitalisation rates for potentially preventable chronic, acute and vaccine-preventable conditions have increased over time.
More on page 8.18 (PDF - 5.5 MB)8.3 Potentially avoidable deaths
Between 1998 and 2018 (for NSW, Queensland, WA, SA and the NT), mortality rates for Aboriginal and Torres Strait Islander people from potentially avoidable deaths declined by 40 per cent.
More on page 8.27 (PDF - 5.5 MB)8.4 Tobacco consumption and harm
Between 2001 and 2018-19, the proportion of Aboriginal and Torres Strait Islander adults who were current daily smokers decreased from 51 per cent to 40 per cent.
Smoking rates have also decreased for non-Indigenous adults at a similar rate, but from a lower base.
More on page 8.34 (PDF - 5.5 MB)8.5 Obesity and nutrition
The proportion of Aboriginal and Torres Strait Islander adults who were overweight or obese increased from 69 per cent in 2012-13 to 74 per cent in 2018-19.
Supplementary data on children’s fruit and vegetable intake in 2017–19 show that 69 per cent of Aboriginal and Torres Strait Islander children reported adequate daily intake of fruit (76 per cent for non-Indigenous children), and about 6 per cent of all children reported adequate daily vegetable intake.
More on page 8.40 (PDF - 5.5 MB)8.6 Oral health
Nationally comparable time series data on tooth decay are not available. Accurate data on dental health are relatively old (for children, the most recent data are for 2012-14 and for adults are for 2017-18). Supplementary data for Aboriginal and Torres Strait Islander people aged 15 years or over show that in 2018-19, 51 per cent reported the loss of one or more teeth, similar to 2012-13.
More on page 8.47 (PDF - 5.5 MB)8.7 Mental health
The proportion of Aboriginal and Torres Strait Islander adults who reported high/very high levels of psychological distress increased from 27 per cent in 2004-05 to 33 per cent in 2014-15 and were similar in 2018-19 (31 per cent).
After adjusting for population age structures, the proportion of Aboriginal and Torres Strait Islander adults experiencing high/very high psychological distress in 2018-19 was more than twice the proportion for non-Indigenous adults in 2017-18.
More on page 8.55 (PDF - 5.5 MB)8.8 Suicide and self-harm
After adjusting for population age structures, the suicide death rate for Aboriginal and Torres Strait Islander people increased by about 40 per cent over the decade to 2018, and continues to be about twice the rate for non-Indigenous people.
Rates for Aboriginal and Torres Strait Islander men are about three-and-a-half times the rate for women (and rising).
More on page 8.65 (PDF - 5.5 MB)Economic participation
Participation in the economy can significantly influence living standards. The extent to which people participate in the economy is closely related to their personal circumstances.
9.1 Employment by full time/part time status, sector and occupation
For employed Aboriginal and Torres Strait Islander 18–64 year olds, the proportion who are in full time employment increased from 55 per cent in 2002 to 63 per cent in 2014-15, and remained at this level in 2018-19.
More on page 9.3 (PDF - 7.5 MB)9.2 Indigenous owned or controlled land and business
As at 30 June 2019, native title had been determined to exist in about 40 per cent of Australia (up from 5 per cent in 2004) and registered Indigenous Land Use Agreements covered 33 per cent of Australia.
In May 2020, Aboriginal and Torres Strait Islander people collectively owned or controlled 15 per cent of land in Australia, with most of this land in very remote areas — similar to 2014 and 2016.
In 2018-19, 11 per cent of employed Aboriginal and Torres Strait Islander adults were self-employed — up from 6 per cent in 2011–13, and similar to 2014–15.
More on page 9.9 (PDF - 7.5 MB)9.3 Home ownership
The proportion of Aboriginal and Torres Strait Islander adults living in a home owned or being purchased by a member of their household increased from 22 per cent in 1994 to 27 per cent in 2002, and has remained at a similar level since (31 per cent in 2018-19). The proportion for non-Indigenous adults decreased from 74 to 68 per cent between 2002 and 2017-18 (earlier data are not available).
More on page 9.29 (PDF - 7.5 MB)9.4 Income support
A lack of comparable data has limited analysis of income sources over time. In 2018-19, government pensions and allowances (45 per cent) and employee income (44 per cent) were jointly the main source of personal cash income for Aboriginal and Torres Strait Islander people aged 18−64 years.
More on page 9.37 (PDF - 7.5 MB)Home environment
Environmental conditions in the home are key to the wellbeing of Aboriginal and Torres Strait Islander people. Environmental health relates to physical, chemical and biological factors external to a person which potentially affect their health. Better environmental health can have positive outcomes for Aboriginal and Torres Strait Islander people and is especially beneficial for children’s physical and emotional wellbeing.
10.1 Overcrowding in housing
The proportion of Aboriginal and Torres Strait Islander people living in overcrowded households decreased from 27 per cent in 2004-05 to 18 per cent in 2018-19, including a decrease in overcrowding in all remote areas from 53 to 42 per cent.
More on page 10.3 (PDF - 1.8 MB)10.2 Rates of disease associated with poor environmental health
Results for this indicator are difficult to interpret with an increase in the hospitalisation rate but no change in the death rate. For NSW, Victoria, Queensland, WA, SA and the NT combined, from 2010-11 to 2018-19, hospitalisation rates for Aboriginal and Torres Strait Islander people increased for just over half of the selected diseases.
For NSW, Queensland, WA, SA and the NT combined, from 2009–2013 to 2014–2018, the death rate for Aboriginal and Torres Strait Islander people from diseases associated with poor environmental health remained relatively unchanged.
More on page 10.14 (PDF - 1.8 MB)10.3 Access to clean water and functional sewerage and electricity services
Data on access to water, sewerage and electricity services in discrete Aboriginal and Torres Strait Islander communities are relatively old and with limited time series. The proportion of Aboriginal and Torres Strait Islander households living in houses of an acceptable standard (including structural issues and working facilities) was 80 per cent in 2018-19, similar to 2008 (following a decrease to 78 per cent in 2012-13).
More on page 10.22 (PDF - 1.8 MB)Safe and supportive communities
Safe and supportive families and communities provide a resilient, caring and protective environment, promoting a range of positive outcomes. However, the history of colonisation and intergenerational trauma has deeply affected Aboriginal and Torres Strait Islander people as individuals and communities in many ways. This trauma has contributed to family and community disruption, alcohol and drug misuse, violence and harm, and contact with the criminal justice system.
11.1 Alcohol consumption and harm
In 2018-19, 20 per cent of Aboriginal and Torres Strait Islander adults reported exceeding lifetime alcohol risk guidelines, similar to 2012-13.
The proportion who reported exceeding the single occasion risk guidelines at least once in the previous 12 months was 53 per cent, also similar to 2012-13.
More on page 11.3 (PDF - 4.4 MB)11.2 Drug and other substance use and harm
The majority of Aboriginal and Torres Strait Islander adults do not misuse substances. In 2018-19, 70 per cent of Aboriginal and Torres Strait Islander adults reported they had not misused substances in the previous 12 months.
But the proportion who report that they are misusing has increased over time (from 23 per cent in 2002 to 28 per cent in 2018-19, with the increase occurring between 2012-13 and 2014-15).
More on page 11.12 (PDF - 4.4 MB)11.3 Youth diversions
Nationally comparable data are not currently available. For most jurisdictions the average diversion rate for Aboriginal and Torres Strait Islander and non-Indigenous young people over the last four years (2015‑16 to 2018-19) was lower or the same as in the preceding four years (2010-11 to 2014-15), indicating a trend nationally towards less diversion.
In 2018-19, rates of diversions for Aboriginal and Torres Strait Islander young people were between 39 and 88 per cent below the rates for non-Indigenous young people.
More on page 11.19 (PDF - 4.4 MB)11.4 Repeat offending
On 30 June 2019, 78 per cent of Aboriginal and Torres Strait Islander adult prisoners had a known prior imprisonment, compared with 50 per cent of non-Indigenous prisoners. These proportions have remained relatively unchanged since 2000.
Over the period 2000-01 to 2018-19, 55 per cent of Aboriginal and Torres Strait Islander young people in sentenced supervision had more than one supervised sentence, compared to 34 per cent for non-Indigenous young people.
More on page 11.25 (PDF - 4.4 MB)11.5 Community functioning
Whilst there is no overall measure of community functioning, outcomes for 2014-15 are not significantly different to those for 2008, for the six themes that make up community functioning: connectedness to Country; land and history; culture and identity; resilience; leadership; having a role, structure and routine; feeling safe; and vitality.
More on page 11.34 (PDF - 4.4 MB)Download the report
- Overcoming Indigenous Disadvantage: Key Indicators 2020 (PDF - 38 614 Kb)
- Overcoming Indigenous Disadvantage: Key Indicators 2020 all chapters (Word/Zip - 5633 Kb)
Download report chapters and data
Click on the headings below to reveal chapter details and data.
Preliminaries and Overview
- Cover
- Copyright and publication details
- Foreword
- Terms and reference
- Contents
- Steering Committee
- Acknowledgments
- Abbreviations
- Glossary
- Key points
See also: Overview booklet
Chapter 1: About this report
- 1.1 About this edition of the OID report
- 1.2 The historical context
- 1.3 Profile of the Aboriginal and Torres Strait Islander population today
Chapter 2: The framework
- 2.1 The focus of the framework is on outcomes
- 2.2 Interactions across the framework
Chapter 3: Understanding the outcomes and how they can be improved
- 3.1 Understanding outcomes for Aboriginal and Torres Strait Islander people
- 3.2 Improving outcomes for Aboriginal and Torres Strait Islander people
Chapter 4: COAG targets and headline indicators
- Chapter 4 and attachments (PDF - 24 541 Kb)
- Chapter 4 (Word - 660 Kb)
- Attachment tables (XLSX - 2934 Kb)
- Pivot tables - Reading, Writing and Numeracy (XLSX - 3891 Kb)
- 4.1 Life expectancy
- 4.2 Young child mortality
- 4.3 Early childhood education
- 4.4 Reading, writing and numeracy
- 4.5 Year 1 to 10 attendance
- 4.6 Year 12 attainment
- 4.7 Employment
- 4.8 Post-secondary education — participation and attainment
- 4.9 Disability and chronic disease
- 4.10 Household and individual income
- 4.11 Substantiated child abuse and neglect
- 4.12 Family and community violence
- 4.13 Imprisonment and youth detention
Chapter 5: Governance, leadership and culture
- Chapter 5 and attachments (PDF - 4778 Kb)
- Chapter 5 (Word - 184 Kb)
- Attachment tables (XLSX - 1166 Kb)
- 5.1 Valuing Aboriginal and Torres Strait Islander people and their cultures
- 5.2 Participation in decision-making
- 5.3 Engagement of services
- 5.4 Case studies in governance
- 5.5 Indigenous language revitalisation and maintenance
- 5.6 Indigenous cultural studies
- 5.7 Participation in community activities
- 5.8 Access to traditional lands and waters
Chapter 6: Early child development
- Chapter 6 and attachments (PDF - 5097 Kb)
- Chapter 6 (Word - 436 Kb)
- Attachment tables (XLSX - 1485 Kb)
- 6.1 Antenatal care
- 6.2 Health behaviours during pregnancy
- 6.3 Teenage birth rate
- 6.4 Birthweight
- 6.5 Early childhood hospitalisations
- 6.6 Injury and preventable diseases
- 6.7 Ear health
- 6.6 Basic skills for life and learning
Chapter 7: Education and training
- 7.1 Teacher quality
- 7.2 School engagement
- 7.3 Transition from school to work
Chapter 8: Healthy lives
- Chapter 8 and attachments (PDF - 5676 Kb)
- Chapter 8 (Word - 473 Kb)
- Attachment tables (XLSX - 1759 Kb)
- 8.1 Access to primary health care
- 8.2 Potentially preventable hospitalisations
- 8.3 Potentially avoidable deaths
- 8.4 Tobacco consumption and harm
- 8.5 Obesity and nutrition
- 8.6 Oral health
- 8.7 Mental health
- 8.8 Suicide and self-harm
Chapter 9: Economic participation
- Chapter 9 and attachments (PDF - 7698 Kb)
- Chapter 9 (Word - 340 Kb)
- Attachment tables (XLSX - 4053 Kb)
- 9.1 Employment by full time/part time status, sector and occupation
- 9.2 Indigenous owned or controlled land and business
- 9.3 Home ownership
- 9.4 Income support
Chapter 10: Home environment
- Chapter 10 and attachments (PDF - 1881 Kb)
- Chapter 10 (Word - 168 Kb)
- Attachment tables (XLSX - 592 Kb)
- 10.1 Overcrowding in housing
- 10.2 Rates of disease associated with poor environmental health
- 10.3 Access to clean water and functional sewerage and electricity services
Chapter 11: Safe and supportive communities
- Chapter 11 and attachments (PDF - 4482 Kb)
- Chapter 11 (Word - 115 Kb)
- Attachment tables (XLSX - 1781 Kb)
- 11.1 Alcohol consumption and harm
- 11.2 Drug and other substance use and harm
- 11.3 Youth diversions
- 11.4 Repeat offending
- 11.5 Community functioning
Chapter 12: Outcomes for Torres Strait Islander people
Appendix A: Population characteristics of Aboriginal and Torres Strait Islander people and their language use
The purpose of this fact sheet is to highlight and summarise important material within the Overcoming Indigenous Disadvantage report. To understand the information in the report, it is important to consider the factors that have affected the outcomes being measured.
Download this fact sheet
How have trends in outcomes over time been assessed?
The figure summarises changes in outcomes over time. The following approach was taken to assessing change over time:
- The key consideration was change over time in outcomes for Aboriginal and Torres Strait Islander people NOT the gap to non-Indigenous people. It is important to acknowledge improvements in outcomes for Aboriginal and Torres Strait Islander people, even if improvements for non-Indigenous people mean that the gap has not narrowed and/or the outcomes for non-Indigenous people are significantly better.
- Change has been assessed by comparing the latest available data to the earliest available data for each indicator in this Report. Therefore, the time period may be different for different indicators.
- If apparent change was not statistically significant this was recorded as no significant change.
- The focus has been on the main measure/s identified for each indicator. Supplementary measures for some indicators may show different trends.
- No trend has been identified where it is not clear whether an observed change in the main measure is positive or negative, or where improvements to data collections have created a break in series.
Results have been summarised into the following five categories:
![]() Progress — where the main measure for an indicator shows outcomes for Aboriginal and Torres Strait Islander people improving over time
Progress — where the main measure for an indicator shows outcomes for Aboriginal and Torres Strait Islander people improving over time
![]() No significant change — where the main measure for an indicator shows no meaningful change in outcomes for Aboriginal and Torres Strait Islander people
No significant change — where the main measure for an indicator shows no meaningful change in outcomes for Aboriginal and Torres Strait Islander people
![]() Regress — where the main measure for an indicator shows a decline in outcomes for Aboriginal and Torres Strait Islander people
Regress — where the main measure for an indicator shows a decline in outcomes for Aboriginal and Torres Strait Islander people
![]() Data gap — where no suitable trend data are available (this does not include indicators where improvements to data collections have created a break in series, which are labelled ‘unclear’)
Data gap — where no suitable trend data are available (this does not include indicators where improvements to data collections have created a break in series, which are labelled ‘unclear’)
![]() Unclear — where it is not clear whether an observed change in the main measure is positive or negative, or where improvements to data collections have created a break in series. Results should be considered in the light of the contextual material in the relevant section of the Report.
Unclear — where it is not clear whether an observed change in the main measure is positive or negative, or where improvements to data collections have created a break in series. Results should be considered in the light of the contextual material in the relevant section of the Report.
There are 52 indicators in this Report. However, one indicator (5.4 Case studies in governance) is not designed to include quantitative measures.
Spread the word and join the conversation on: ![]() Twitterand/or
Twitterand/or ![]() Facebook
Facebook