Superannuation policy for post-retirement
Commission research paper
This paper was released on 7 July 2015. This report is a detailed analysis of two aspects of superannuation policy affecting the post-retirement phase:
- What might happen if the age that individuals can access their superannuation (the 'preservation age') were raised?
- Is the way people draw down their superannuation, and in particular, the use of lump sums, problematic?
As part of its research for this paper, the Commission has developed a model - referred to as the Productivity Commission Retirement Model (PCRM) - to assess the effects of increasing the preservation age. Modelling supplementary papers are available from the tab below.
Download the paper
- Volume 1: Superannuation Policy for Post-Retirement (PDF - 1863 Kb)
- Volume 1: Superannuation Policy for Post-Retirement (Word/Zip - 2113 Kb)
- Key points
- Media release
- Contents
- Modelling supplements
- Infographics
Australia's ageing population will increase demands on the retirement income system. With this in mind, this report seeks to improve understanding of two elements of the retirement income puzzle - when and how individuals access their superannuation.
The preservation age - the age at which people can access their superannuation savings - is considered by some to be an important policy lever in managing the transition to an older Australia. The Commission has found that, consistent with expectations, raising the preservation age encourages some people to work longer and accumulate more superannuation.
Modelling undertaken by the Commission in order to better understand the response of individuals to a gradual increase in the preservation age to 65 suggests that:
- there will be a modest increase in the participation rate of older workers (of around 2 percentage points in 2055) - mainly among those with higher wealth at or near retirement
- households that delay their retirement are likely to do so by around two years and will have superannuation balances around 10 per cent larger in real terms when they retire
- there will be an indicative annual fiscal improvement of around $7 billion (in 2015 prices) in 2055 - mainly due to tax revenue increases from wealthier households
- changing the preservation age will have little, if any, impact on the workforce participation of individuals who retire involuntarily - almost one half of men and over one third of women who retire between the ages of 60 and 64.
Once they have access to their superannuation savings, individuals are afforded much flexibility in drawing them down. Some consider that this discretion is desirable given the diverse circumstances of retirees. Others are concerned that it encourages individuals to exhaust their superannuation too quickly by taking lump sums and leads to more reliance on the Age Pension.
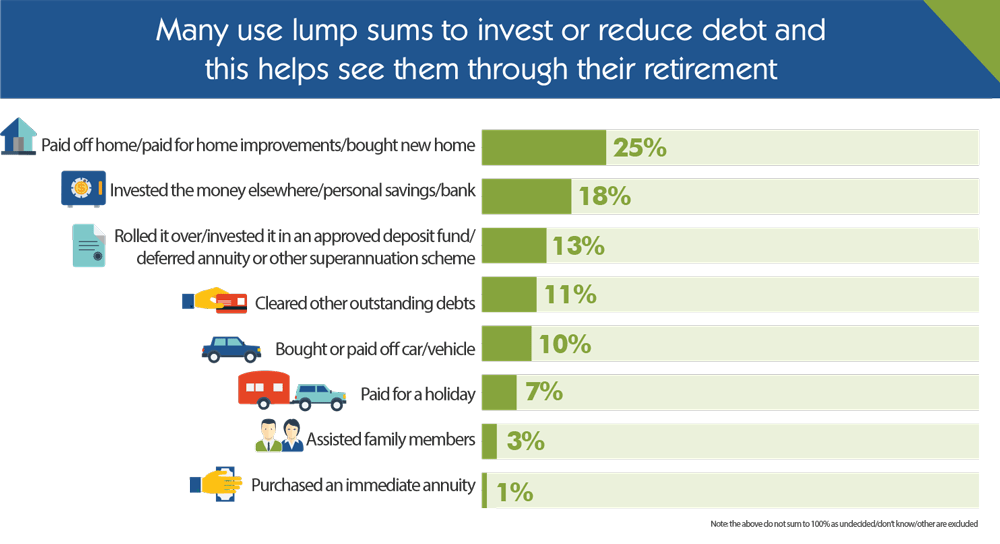
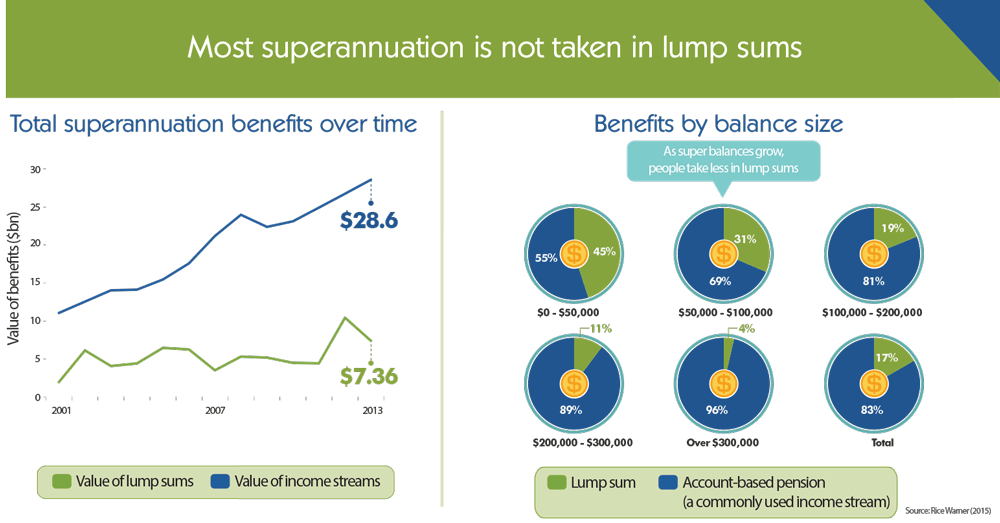
The evidence suggests that most retirees are prudent in their drawdown behaviour. Less than 30 per cent of superannuation benefits are taken as lump sums. When retirees do take lump sums, they are most frequently used to pay down debt, invest in income stream products, and purchase durable goods that are used throughout retirement.
Lump sum use is not uniform, and is most prevalent among those with low superannuation balances (less than $10 000). These households tend to take between half and all of their superannuation assets as a lump sum. The evidence suggests that this behaviour has little impact on Age Pension reliance.
In undertaking its analysis, the Commission has identified a range of policy areas that warrant further and collective attention. These include:
- how involuntary retirement impacts policy outcomes
- the way in which incentives inherent in the retirement income system affect individuals' savings and retirement decisions
- how the retirement income system can better cater for the diverse circumstances and needs of retirees, particularly in the drawdown stage where 'one size' never fits all
- how to best manage longevity risk given the demographic transition underway.
The retirement income system has seen ongoing change to its components, albeit with less focus on the drawdown phase. But its overarching objectives remain poorly defined. Ideally, future changes to the system would be guided by a common set of objectives, informed by the principles of sustainability and efficacy, and considered as part of a holistic review involving considered and extensive community consultation.
Examining when and how people access their Superannuation
Today the Productivity Commission released its research paper Superannuation Policy for Post-Retirement. The report is a policy research sequel to the Commission's 2013 flagship research project An Ageing Australia: Preparing for the Future. Australia's ageing population has important implications for the retirement income system. This research report considers two important aspects of retirement behaviour — when and how people access their superannuation.
The report examines what might happen if the age that individuals can access their superannuation — the preservation age — were raised. Modelling undertaken by the Commission in order to better understand the impacts of a gradual increase in the preservation age to 65 years suggests that:
- there will be a modest increase in the workforce participation of older workers of around 2 percentage points in 2055 — mainly among those with higher wealth at or near retirement
- households that delay their retirement are likely to do so by around two years and will have superannuation balances around 10 per cent larger in real terms when they retire
- there will be an indicative annual fiscal improvement of around $7 billion in 2055 — mainly due to more tax revenue from wealthier households
- changing the preservation age will have little, if any impact, on the many older Australians who retire involuntarily. Currently, almost one half of men and around one third of women who retire between the ages of 60 and 64 do so involuntarily.
While the report has assessed the likely impacts of raising the preservation age, important implementation issues would need to be considered and resolved before any changes are made. For example, an appropriate safety net for those who become involuntarily retired would be a priority.
The report also finds that most retirees are prudent in the way they draw down their superannuation. While the use of lump sums attracts much attention, the report finds that their use is not problematic. Less than 30 per cent of superannuation benefits are taken as lump sums, with most superannuation benefits taken as income streams. Where lump sums are taken, they are most frequently used to pay down debt, invest in income stream products, and purchase durable goods that are used throughout retirement.
The report finds that changes to the retirement income system need to cater for the diverse circumstances of retirees, where 'one size' does not fit all. In undertaking its analysis, the Commission identified a number of features of the retirement income system that warrant more detailed and collective analysis, and considers that there would be merit in a holistic review of retirement incomes policy, informed by considered and extensive community consultation.
As a research project, the report makes no recommendations but its analysis and conclusions may be of relevance for future policy development. The Commission has also initiated a follow on policy research project examining the housing decisions of older Australians.
- Preliminaries
- Cover, Copyright and publication detail, Foreword, Contents, Acknowledgments and Abbreviations and expanations.
Volume 1
- Overview
- Chapter 1 Setting the scene
- 1.1 The role of superannuation in Australia's retirement income system
- 1.2 The growing importance of a well-functioning superannuation system
- 1.3 The focus of this report
- Chapter 2 The public-private balance of retirement funding
- 2.1 How do individuals save for retirement?
- 2.2 How does the Age Pension support retirement incomes?
- 2.3 The balance between private and public funding in a mature system
- Chapter 3 Preservation age and retirement decisions
- 3.1 What influences the retirement decisions of mature age workers?
- 3.2 How is retirement behaviour changing?
- 3.3 Will further increasing the preservation age impact retirement decisions?
- 3.4 Where to from here?
- Chapter 4 Is drawdown behaviour a concern?
- 4.1 What do people say about lump sums?
- 4.2 How is superannuation being drawn down?
- 4.3 How are lump sums being used?
- 4.4 Do lump sums encourage premature access to the Age Pension?
- 4.5 How might drawdown behaviour change as the system matures?
- 4.6 Are income streams working well for retirees?
Volume 2
- Supplementary paper 1 The superannuation policy environment
- 1.1 Rules governing accumulation
- 1.2 Rules governing access and draw down
- 1.3 Rules governing early access
- Supplementary paper 2 Savings and accumulation
- 2.1 Savings in general
- 2.2 Superannuation savings in detail
- 2.3 How have savings changed and how will they change in the future?
- Supplementary paper 3 The Age Pension
- 3.1 The Age Pension policy environment
- 3.2 Recent trends in Age Pension coverage
- 3.3 Projections of Age Pension coverage
- Supplementary paper 4 Financial literacy
- 4.1 What is financial literacy and how can it be measured?
- 4.2 Why is there a lack of financial literacy when it comes to superannuation?
- 4.3 What measures are there to improve financial literacy?
- 4.4 Should more be done to improve financial literacy when it comes to superannuation and retirement?
- 4.5 Complements to improving financial literacy
- Supplementary paper 5 Involuntary retirement among mature age workers
- 5.1 What drives the labour force participation decisions of older workers?
- 5.2 How common is involuntary retirement?
- 5.3 What are the characteristics of the involuntarily retired?
- 5.4 What is happening to rates of involuntary retirement over time?
- Supplementary paper 6 The Commission's retirement model
- 6.1 The Commission's approach
- 6.2 Caveats
- 6.3 Assessing the effects of policy changes
- 6.4 Model mechanisms, drivers and results
- 6.5 Sensitivity analysis
- Supplementary paper 7 The drawbacks of drawdown data
- 7.1 Why are robust data important?
- 7.2 What are the drawbacks of drawdown data?
- 7.3 The Commission's approach to drawdown data
- Appendix A Conduct of the project
- References
As part of its research on Superannuation Policy for Post Retirement the Commission has developed a model - referred to as the Productivity Commission Retirement Model (PCRM) - to assess the effects of increasing the preservation age. The PCRM can be described as a 'behavioural microsimulation' model.
Behavioural microsimulation models seek to simulate individual or household level decisions, and are commonly used within an economic framework to assess the impact of policy changes (such as changes in tax and benefits) on governments' fiscal positions and on labour supply. They are particularly useful where there is a wide variety of decision makers, and where complex policy changes are likely to impact these different decision makers in different ways.
- Modelling Supplement 1: Voluntary Retirement Module Inputs (PDF - 255 Kb)
- Modelling Supplement 1: Voluntary Retirement Module Inputs (Word - 79 Kb)
- Modelling Supplement 2: Voluntary Retirement Module Specification (PDF - 331 Kb)
- Modelling Supplement 2: Voluntary Retirement Module Specification (Word - 58 Kb)
- Modelling Supplement 3: Projection Module: Data Sources and Methodology (PDF - 227 Kb)
- Modelling Supplement 3: Projection Module: Data Sources and Methodology (Word - 65 Kb)
- Modelling Supplement 4: The Calibration Process (PDF - 177 Kb)
- Modelling Supplement 4: The Calibration Process (Word - 53 Kb)
- Modelling Supplement 5: An Illustration of Models Results (PDF - 191 Kb)
- Modelling Supplement 5: An Illustration of Models Results (Word - 159 Kb)
Download the infographic



Superannuation policy for post-retirement (text version of infographic)
Examining when and how people access their superannuation
A research report by the Productivity Commission.
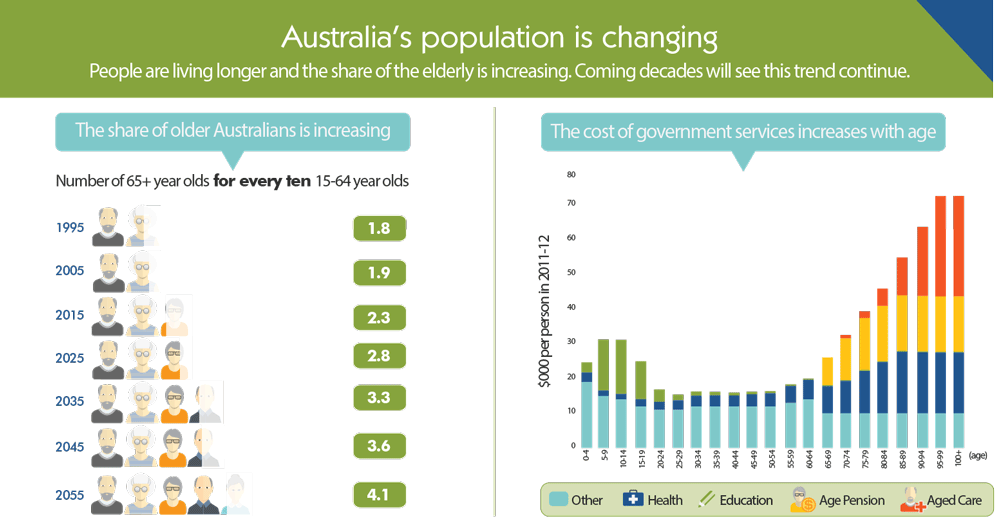
Australia's population is changing
People are living longer and the share of the elderly is increasing. Coming decades will see this trend continue.
The share of older Australians is increasing
| 1995 | 1.8 |
|---|---|
| 2005 | 1.9 |
| 2015 | 2.3 |
| 2025 | 2.8 |
| 2035 | 3.3 |
| 2045 | 3.6 |
| 2055 | 4.1 |
The cost of government services increases with age
| Age | Age Pension | Aged Care | Health | Education | Other |
|---|---|---|---|---|---|
| 0-4 | 0 | 0 | 2.81 | 2.92 | 19 |
| 5-9 | 0 | 0 | 1.59 | 14.76 | 15 |
| 10-14 | 0 | 0 | 1.63 | 15.62 | 14 |
| 15-19 | 0 | 0 | 2.10 | 10.94 | 14 |
| 20-24 | 0 | 0 | 2.32 | 3.57 | 11 |
| 25-29 | 0 | 0 | 2.77 | 1.67 | 11 |
| 30-34 | 0 | 0 | 3.10 | 1.21 | 12 |
| 35-39 | 0 | 0 | 3.22 | 1.00 | 12 |
| 40-44 | 0 | 0 | 3.15 | 0.85 | 12 |
| 45-49 | 0 | 0 | 3.51 | 0.73 | 12 |
| 50-54 | 0 | 0 | 3.81 | 0.59 | 12 |
| 55-59 | 0 | 0 | 4.91 | 0.47 | 13 |
| 60-64 | 0 | 0 | 5.67 | 0.37 | 14 |
| 65-69 | 8 | 0 | 7.85 | 0.32 | 10 |
| 70-74 | 12 | 1 | 9.36 | 0.29 | 10 |
| 75-79 | 15 | 2 | 12.24 | 0.28 | 10 |
| 80-84 | 16 | 5 | 14.80 | 0.27 | 10 |
| 85-89 | 16 | 11 | 17.79 | 0.27 | 10 |
| 90-94 | 16 | 20 | 17.63 | 0.27 | 10 |
| 95-99 | 16 | 29 | 17.54 | 0.27 | 10 |
| 100+ | 16 | 29 | 17.54 | 0.30 | 10 |
The costs associated with ageing have been explored extensively, but some questions remain unanswered:
- How well is the retirement income system placed to deal with demographic change?
- What reforms might ease pressures while delivering sustainable retirement incomes for older Australians?
The Commission has sought to advance understanding of these issues by addressing two questions:
- What might happen if the age that people can access their superannuation (the 'preservation age') were raised?
- Is the way people draw down their superannuation, and in particular the use of lump sums, problematic?
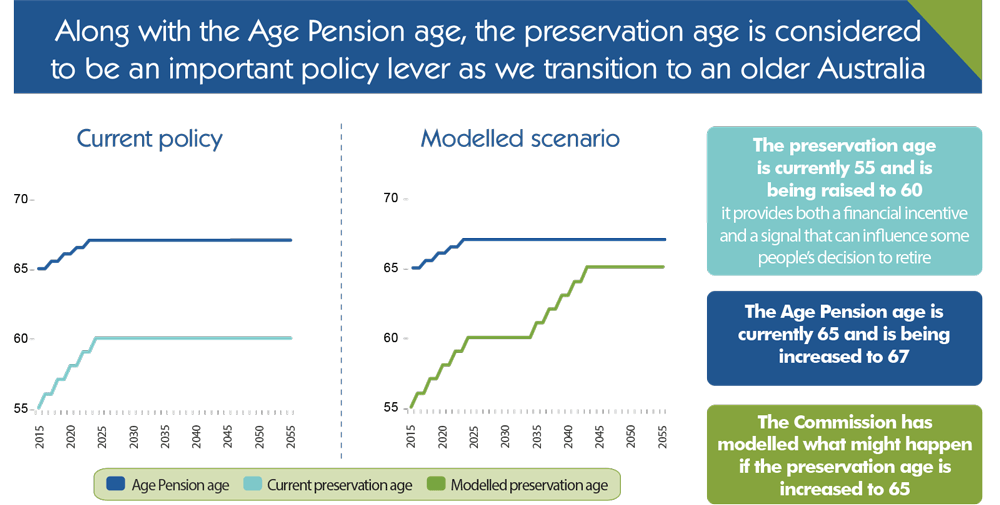
Along with the Age Pension age, the preservation age is considered to be an important policy lever as we transition to an older Australia.
The preservation age is cureently 55 and is being raised to 60, it provides both a financial incentive and a signal that can influence some people's decision to retire.
The Age Pension age is currently 65 and is being increased to 67.
The Commission has modelled what might happen if the preservation age is increased to 65.
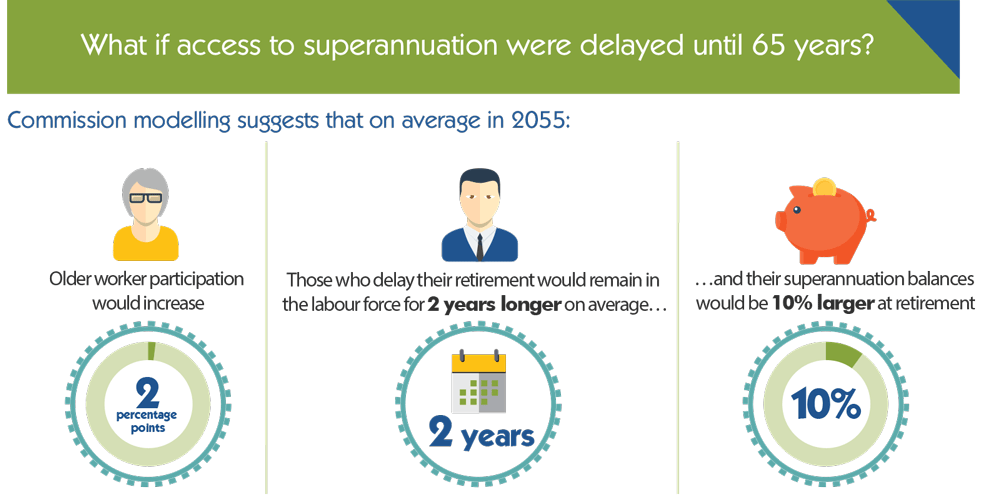
What if access to superannuation were delayed until 65 years?
Commission modelling suggests that on average in 2055:
- Older worker participation would increase by 2 percentage points.
- Those who delay their retirement would remain in the labour force for 2 years longer on average... and their superannuation balances would be 10% larger at retirement.
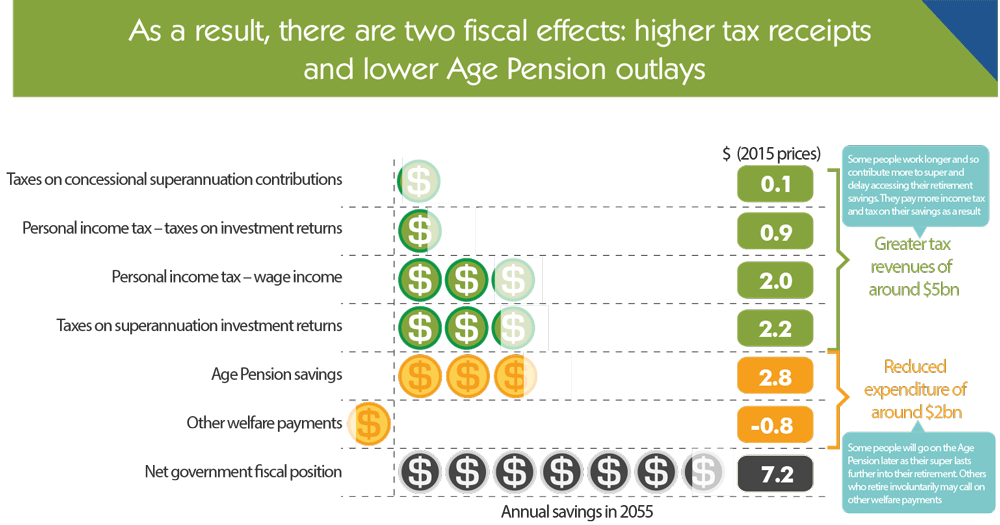
As a result, there are two fiscal effects: higher tax receipts and lower Age Pension outlays.
| Taxes on concessional superannuation contributions | 0.1 | Greater tax revenues of around $5bn. Some people work longer and so contribute more to super and delay accessing their retirement savings. They pay more income tax and tax on their savings as a result. |
|---|---|---|
| Personal income tax - taxes on investment returns | 0.9 | |
| Personal income tax - wage income | 2.0 | |
| Taxes on superannuation investment returns | 2.2 | |
| Age Pension savings | 2.8 | Reduced expenditure of around $2bn. Some people will go on the Age Pension later as their super lasts further into their retirement. Others who retire involuntarily may call on other welfare payments. |
| Other welfare payments | -0.8 | |
| Net government fiscal position | 7.2 |
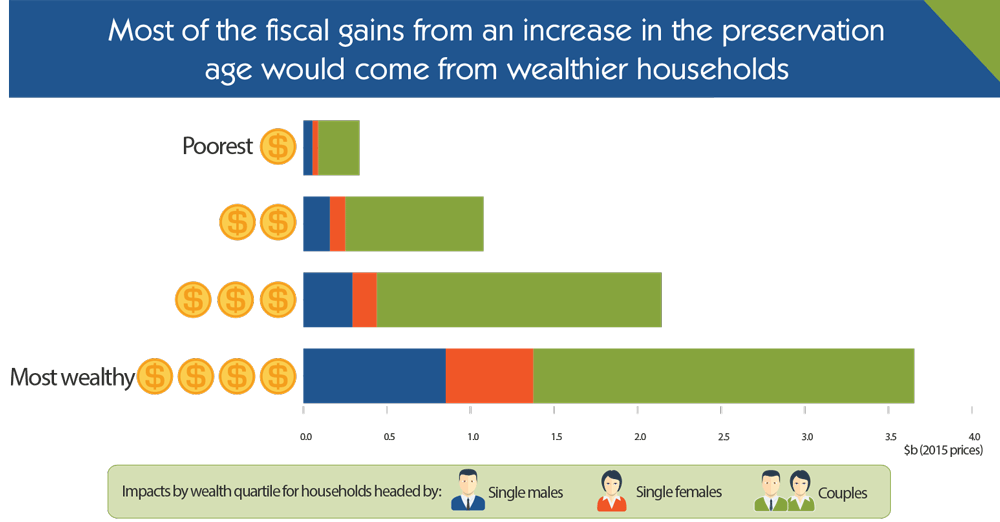
Most of the fiscal gains from an increase in the preservation age would come from wealthier households.
| Quartile | Single Male | Single Female | Couples |
|---|---|---|---|
| 1 (Poorest) | 0.05 | 0.03 | 0.25 |
| 2 | 0.16 | 0.09 | 0.83 |
| 3 | 0.29 | 0.15 | 1.70 |
| 4 (Most wealthy) | 0.85 | 0.52 | 2.28 |
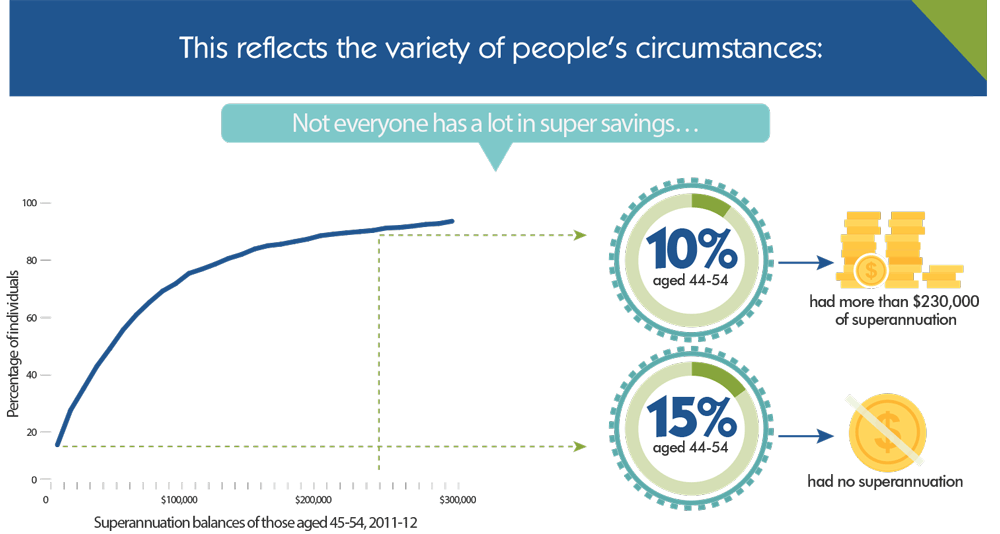
This reflects the variety of people's circumstances.
Not everyone has a lot in super savings. In 2011-12, 10% aged 44-54 had more than $230,000 of superannuation and 15% aged 44-54 had no superannuation.
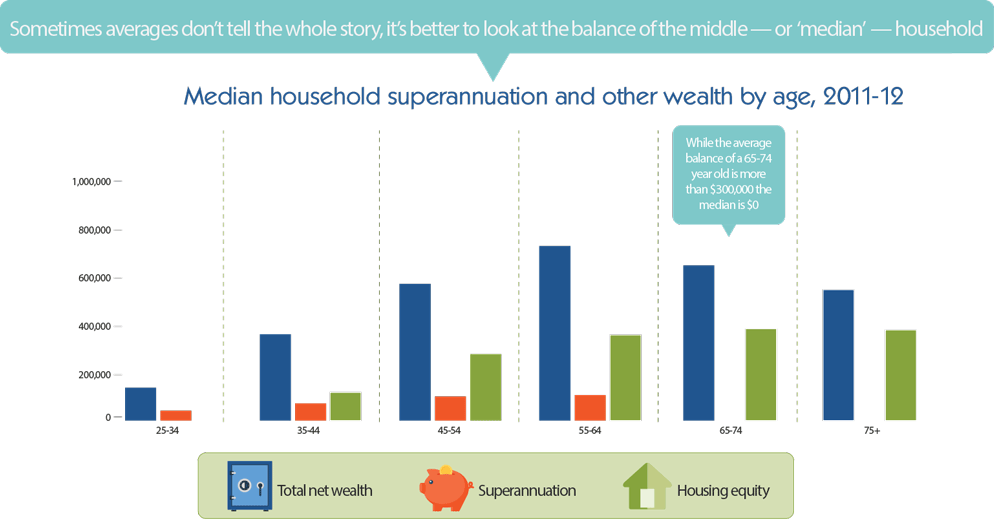
Sometimes averages don't tell the whole story, it's better to look at the balance of the middle - or 'median' - household. While the average balance of a 65-74 year old is more than $300,000 the median is $0.
| Age | Total net wealth | Superannuation | Housing equity |
|---|---|---|---|
| 25-34 | 136,526 | 41,000 | 0 |
| 35-44 | 358,000 | 72,000 | 116,654 |
| 45-54 | 565,998 | 100,000 | 275,000 |
| 55-64 | 723,000 | 106,000 | 355,000 |
| 65-74 | 642,519 | 0 | 380,000 |
| 75+ | 541,748 | 0 | 375,000 |
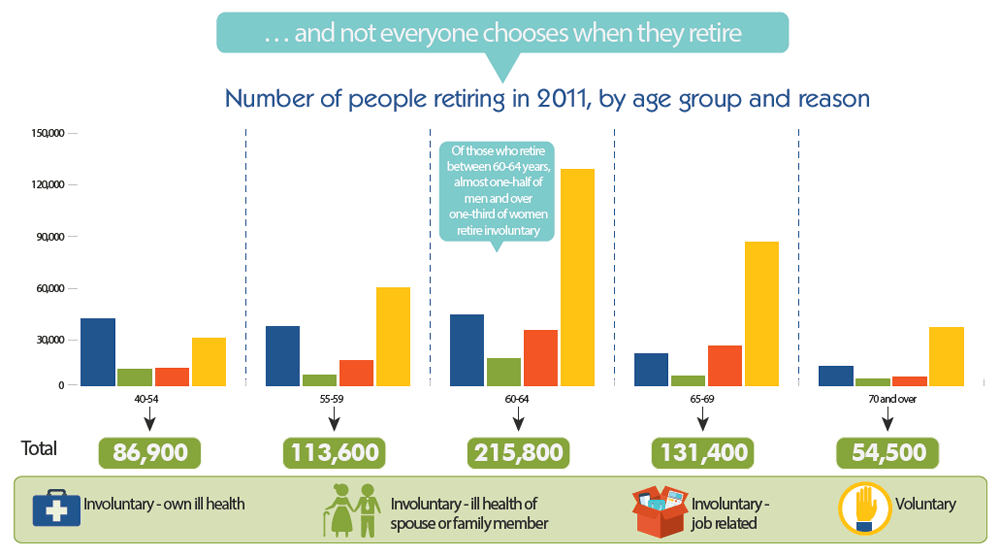
Not everyone chooses when they retire. Of those who retire between 60-64 years, almost one-half of men and over one-third of women retire involuntary.
| Age | Involuntary - own health | Involuntary - ill health of spouse or family member | Involuntary - Job related | Voluntary | Total |
|---|---|---|---|---|---|
| 40-54 | 38 900 | 9800 | 10 600 | 27 700 | 86 900 |
| 55-59 | 34 800 | 6400 | 14 900 | 57 400 | 113 600 |
| 60-64 | 41 200 | 16 100 | 32 400 | 126 100 | 215 800 |
| 65-69 | 18 800 | 5600 | 23 400 | 83 700 | 131 400 |
| 70 and over | 11 300 | 3900 | 5200 | 34 100 | 54 500 |
Is the way people draw down their superannuation problematic?
Some argue that people exhaust their superannuation too quickly by taking lump sums at retirement - there have been calls to restrict lump sums.
| Paid off home/paid for home improvements/bought new home | 25% |
| Invested the money elsewhere/personal savings/bank | 18% |
| Rolled it over/invested it in an approved deposit fund/ deferred annuity or other superannuation scheme | 13% |
| Cleared other outstanding debts | 11% |
| Bought or paid off car/vehicle | 10% |
| Paid for a holiday | 7% |
| Assisted family members | 3% |
| Purchased an immediate annuity | 1% |
Note: the above do not sum to 100% as undecided/don't know/other are excluded.
Most superannuation is not taken in lump sums
| Year | Value of lump sums | Value of income streams |
|---|---|---|
| 2001 | 1.93 | 11.05 |
| 2002 | 6.10 | 12.53 |
| 2003 | 4.06 | 14.01 |
| 2004 | 4.39 | 14.11 |
| 2005 | 6.45 | 15.45 |
| 2006 | 6.23 | 17.56 |
| 2007 | 3.49 | 21.17 |
| 2008 | 5.29 | 23.96 |
| 2009 | 5.16 | 22.37 |
| 2010 | 4.47 | 23.10 |
| 2011 | 4.40 | 24.92 |
| 2012 | 10.42 | 26.73 |
| 2013 | 7.36 | 28.59 |
| Balance | Account-based pension (a commonly used income stream) | Lump sum |
|---|---|---|
| $0 - $50,000 | 55% | 45% |
| $50,000 - $100,000 | 69% | 31% |
| $100,000 - $200,000 | 81% | 19% |
| $200,000 - $300,000 | 89% | 11% |
| Over $300,000 | 96% | 4% |
| Total | 83% | 17% |
Source: Rice Warner (2015)
As super balances grow, people take less in lump sums.
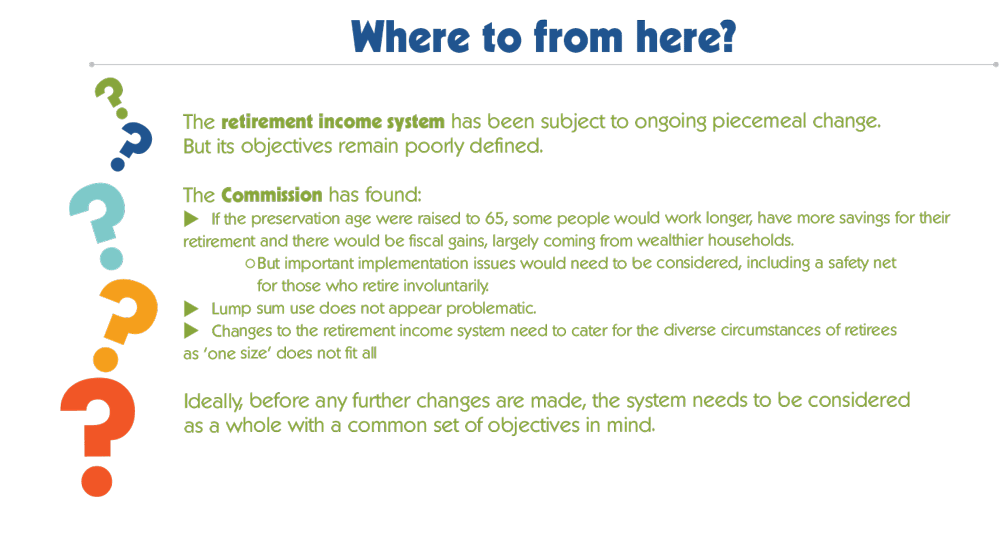
Where to from here?
The retirement income system has been subject to ongoing piecemeal change. But its objectives remain poorly defined.
The Commission has found:
- If the preservation age were raised to 65, some people would work longer, have more savings for their
retirement and there would be fiscal gains, largely coming from wealthier households.
- But important implementation issues would need to be considered, including a safety net for those who retire involuntarily.
- Lump sum use does not appear problematic.
- Changes to the retirement income system need to cater for the diverse circumstances of retirees as 'one size' does not fit all.
Ideally, before any further changes are made, the system needs to be considered as a whole with a common set of objectives in mind.
Read more detail in the paper.
Printed copies
Printed copies of this report can be purchased from Canprint Communications.
Publications feedback
We value your comments about this publication and encourage you to provide feedback.