Overcoming Indigenous Disadvantage: Key Indicators 2014
The Overcoming Indigenous Disadvantage report measures the wellbeing of Australia's Indigenous peoples. The report provides information about outcomes across a range of strategic areas such as early child development, education and training, healthy lives, economic participation, home environment, and safe and supportive communities. The report examines whether policies and programs are achieving positive outcomes for Indigenous Australians.
The 2014 report which was release on 19 November 2014 shows that, nationally, for Aboriginal and Torres Strait Islander Australians:
- economic outcomes have improved over the longer term, with higher incomes, lower reliance on income support, increased home ownership, and higher rates of full time and professional employment. However, improvements have slowed in recent years
- several health outcomes have improved, including increased life expectancy and lower child mortality. However, rates of disability and chronic disease remain high, mental health outcomes have not improved, and hospitalisation rates for self-harm have increased
- post-secondary education outcomes have improved, but there has been virtually no change in literacy and numeracy results at school, which are particularly poor in remote areas
- justice outcomes continue to decline, with adult imprisonment rates worsening and no change in high rates of juvenile detention and family and community violence.
Please note: Aboriginal and Torres Strait Islander people are advised that this website may contain names, images and voices of deceased people. It may also link to other websites which contain names, images and voices of deceased people.
- At a glance
- Overview
- Report
- Fact sheets
Media release
Overcoming Indigenous Disadvantage 2014
The 2014 Overcoming Indigenous Disadvantage (OID) report released today shows some positive trends in the wellbeing of Aboriginal and Torres Strait Islander Australians, with improvements in health, education and economic outcomes. However, results in areas such as justice and mental health continue to cause concern.
The report shows that, nationally, for Aboriginal and Torres Strait Islander Australians:
- economic outcomes have improved over the longer term, with higher incomes, lower reliance on income support, increased home ownership, and higher rates of full time and professional employment. However, improvements have slowed in recent years
- several health outcomes have improved, including increased life expectancy and lower child mortality. However, rates of disability and chronic disease remain high, mental health outcomes have not improved, and hospitalisation rates for self-harm have increased
- post-secondary education outcomes have improved, but there has been virtually no change in literacy and numeracy results at school, which are particularly poor in remote areas
- justice outcomes continue to decline, with adult imprisonment rates worsening and no change in high rates of juvenile detention and family and community violence.
'It has been almost three years since the last OID report. For this report we made a concerted effort to increase the involvement of Aboriginal and Torres Strait Islander Australians. Their input contributed to significant developments, including broadening the focus from overcoming disadvantage to improving wellbeing, and the inclusion of new indicators, such as Indigenous language revitalisation and maintenance, valuing Indigenous cultures (including experiences of racism and discrimination) and participation in decision making' said Peter Harris, chairman of the Productivity Commission and of the Steering Committee.
The OID report is the most comprehensive report on Indigenous wellbeing produced in Australia. It contains accessible data for an extensive range of wellbeing measures as well as case studies of programs that have led to improved outcomes. “This report should be compulsory reading for anyone interested in outcomes for Aboriginal and Torres Strait Islander Australians or working in service delivery or program design,” said Commissioner Patricia Scott, who convenes the expert working group that advises on the report.
The report is a product of the Review of Government Service Provision. It is overseen by a Steering Committee comprising senior officials from the Australian, State and Territory governments, and supported by a secretariat from the Productivity Commission. This report is the sixth in the series, which traces its origins to the final report of the Council for Aboriginal Reconciliation in 2000.
Key points
- This report measures the wellbeing of Aboriginal and Torres Strait Islander Australians, and was produced in consultation with governments and Aboriginal and Torres Strait Islander Australians. Based on 2011 Census data, as at June 2011, around 3 per cent of the Australian population (approximately 670 000 people) were estimated as being of Aboriginal or Torres Strait Islander origin.
- Outcomes have improved in a number of areas, including some COAG targets.
- The gap in life expectancy narrowed from 11.4 years to 10.6 years for males and from 9.6 years to 9.5 years for females from 2005-2007 to 2010-2012.
- Mortality rates for children improved significantly between 1998 and 2012, particular for 0<1 year olds, whose mortality rates more than halved (from 14 to 5 deaths per 1000 live births). In addition, the proportion of low birthweight babies has decreased.
- The proportion of 20-24 year olds completing year 12 or above increased from 45 per cent in 2008 to 59 per cent in 2012-13.
- The proportion of 20-64 year olds with or working towards post-school qualifications increased from 26 per cent in 2002 to 43 per cent in 2012-13.
- The proportion of adults whose main income was from employment increased from 32 per cent in 2002 to 41 per cent in 2012-13, with a corresponding decrease in the proportion on income support. Increasing proportions of employed people were in full time and managerial positions.
- However, there has been little or no change for some indicators.
- There was virtually no change in the proportions of students achieving national minimum standards for reading, writing and numeracy from 2008 to 2013.
- Relatively high rates of family and community violence were unchanged between 2002 and 2008, and there was little change in alcohol and substance use and harm over time.
- Relatively high rates of disability and chronic disease have not changed.
- Outcomes have worsened in some areas.
- The proportion of adults reporting high/very high levels of psychological distress increased from 27 per cent in 2004-05 to 30 per cent in 2012-13, and hospitalisations for intentional self-harm increased by 48 per cent over this period.
- The adult imprisonment rate increased 57 per cent between 2000 and 2013. Juvenile detention rates increased sharply between 2000-01 and 2007-08, and fluctuated since at around 24 times the rate for non Indigenous youth.
- Change over time cannot be assessed for all the indicators - some indicators have no trend data; some indicators report on use of services and change over time might be due to changing access to services rather than changes in the underlying outcome (for example, child protection rates); and some indicators include related measures that have moved in different directions (for example, children's hospitalisations for injury and disease have increased but death rates have decreased).
Video: Overcoming Indigenous Disadvantage 2014
Transcript of video
Overcoming Indigenous Disadvantage 2014
The Overcoming Indigenous Disadvantage Report 2014 is the most comprehensive wellbeing report of its kind, produced in Australia.
More than data, statistics and measurements, the report tells the very real story of the wellbeing of Aboriginal and Torres Strait Islander Australians.
It's about the strengths and resilience of Indigenous peoples across Australia preserving culture, improving health, increasing education outcomes and employment opportunities and cultivating strong leadership and governance.
If you want to know about the wellbeing of Aboriginal and Torres Strait Islanders and are interested in policy and service delivery, this report is a must read.
For Indigenous Australians, just like me, the report highlights positive change and progress. It also tells us where there are gaps in outcomes compared with non-Indigenous people and where there is more work to do.
Let's take a closer look.
More young people are completing Year 12.
Getting educated - 59% of young people had completed year 12 in 2012 - 2013.
And getting post Year 12 qualifications.
Indigenous Australians who have a bachelor's degree are just as likely to get a job as other non- Indigenous Australians with the same qualification.
We're living longer.
Birth weights are improving and infant mortality is falling.
We're smoking less.
We're earning more, working full time, in senior, professional roles.
And as a result relying less on government.
Our culture and history is regarded as important by over 80% of all Australians.
While there's good news, there remains some very serious issues for our people.
We're still over-represented in the criminal justice system as both victims and offenders.
The number of our youths in detention got worse as did the number of Indigenous adults in prison.
The rates of child abuse and neglect remain very high.
Our mental health issues occur at a higher rate than non-Indigenous Australians.
With psychological distress three times higher.
And suicide and self-harm two times higher.
The number of Indigenous languages being spoken continues to decrease, posing a challenge to preserving our native tongues.
But is offset with Indigenous speakers holding steady at 17% with 20% of our youth actively learning an Indigenous language.
Some of the positive outcomes can be linked to successful programs that are making real differences like.
'Families as First Teachers' in the Northern Territory, which is run in 21 remote Indigenous communities since mid 2011, the program promotes early learning and parenting support. Since starting, pre-school enrolments in those communities has increased.
The Yiriman Project, taking young people and elders on trips back to country to immerse them in the stories, songs and knowledge of their cultural heritage - building confidence and self-esteem, helping curb suicide, self harm and substance abuse in participating communities. So go on explore the facts and share in our wellbeing - where we've come from and where we heading too.
You can find the complete report plus overviews and fact sheets on the Australian Government Productivity Commission website www.pc.gov.au
And join in the conversation on Facebook and Twitter. Use the handle @oidozprodcom
It's about yesterday, today and tomorrow.
Download the Overview booklet
Contents
- Preliminaries
- Cover, Copyright and publication detail, Contents, Steering Committee, Acknowledgments
- Key points
- Key indicators
- Overview
- What is the Overcoming Indigenous Disadvantage report?
- Understanding Indigenous disadvantage
- The OID indicator framework
- COAG targets and headline indicators
- COAG targets
- Life expectancy at birth
- Young child mortality
- Early childhood education
- Reading, writing and numeracy
- Year 12 attainment
- Employment
- Headline indicators
- Post-secondary education - participation and attainment
- Disability and chronic disease
- Household and individual income
- Substantiated child abuse and neglect
- Family and community violence
- Imprisonment and juvenile detention
- COAG targets
- Strategic areas for action
- Governance, leadership and culture
- Early child development
- Education and training
- Healthy lives
- Economic participation
- Home environment
- Safe and supportive communities
- Outcomes for Torres Strait Islander people
- Multiple disadvantage
- Future directions in data
Download the report
- Overcoming Indigenous Disadvantage: Key Indicators 2014 (PDF - 30 553 Kb)
- Overcoming Indigenous Disadvantage: Key Indicators 2014 all chapters (Word/Zip - 4886 Kb)
Download the report by chapters
Preliminaries and Overview
- Cover
- Copyright and publication detail
- Foreword
- Terms of reference
- Contents
- Steering Committee
- Acknowledgments
- Acronyms and abbreviations
- Glossary
See also: Overview booklet
Chapter 1: Introduction
- Origins of the OID report
- Role of the OID report
- Putting the OID report into context
- Purpose of the report
- The historical context
- Recent COAG developments
- The Review of Government Service Provision
- References
Chapter 2: The framework
- The framework
- Changes to the framework for this report
- References
Chapter 3: Key themes and interpretation
- Estimating the Aboriginal and Torres Strait Islander
- populations
- Interpreting data in the report
- Demographics of the Aboriginal and Torres Strait Islander
- population
- Remoteness
- Interactions across the report
- Things that work � success factors
- International comparisons
- References
Chapter 4: COAG targets and headline indicators
- Chapter 4 and attachments (PDF - 9423Kb)
- Chapter 4 (Word - 559 Kb)
- Attachment tables (XLSX - 3500 Kb)
- Life expectancy
- Young child mortality
- Early childhood education
- Reading, writing and numeracy
- Year 12 attainment
- Employment
- Post secondary education
- Disability and chronic disease
- Household and individual income
- Substantiated child abuse and neglect
- Family and community violence
- Imprisonment and juvenile detention
Chapter 5: Governance, leadership and culture
- Chapter 5 and attachments (PDF - 2396 Kb)
- Chapter 5 (Word - 284 Kb)
- Attachment tables (XLSX - 592 Kb)
- Valuing Indigenous Australians and their cultures
- Participation in decision making
- Engagement with services
- Case studies in governance
- Indigenous language revitalisation and maintenance
- Indigenous cultural studies
- Participation in community activities
- Access to traditional lands and waters
Chapter 6: Early child development
- Chapter 6 and attachments (PDF - 8206 Kb)
- Chapter 6 (Word - 240 Kb)
- Attachment tables (XLSX - 1441 Kb)
- Antenatal care
- Health behaviours during pregnancy
- Teenage birth rate
- Birthweight
- Early childhood hospitalisations
- Injury and preventable disease
- Ear Health
- Basic skills for life and learning
Chapter 7: Education and training
- Chapter 7 and attachments (PDF - 1938 Kb)
- Chapter 7 (Word - 99 Kb)
- Attachment tables (XLSX - 562 Kb)
- Year 1 to 10 attendance
- Teacher quality
- School engagement
- Transition from school to work
Chapter 8: Healthy lives
- Chapter 8 and attachments (PDF - 3845 Kb)
- Chapter 8 (Word - 184 Kb)
- Attachment tables (XLSX - 2672 Kb)
- Access to primary health care
- Potentially preventable hospitalisations
- Potentially avoidable deaths
- Tobacco consumption and harm
- Obesity and nutrition
- Oral health
- Mental health
- Suicide and self-harm
Chapter 9: Economic participation
- Chapter 9 and attachments (PDF - 5486 Kb)
- Chapter 9 (Word - 188 Kb)
- Attachment tables (XLSX - 5410 Kb)
- Employment by full time/part time status, sector and occupation
- Indigenous owned or controlled land and business
- Home ownership
- Income support
Chapter 10: Home environment
- Chapter 10 and attachments (PDF - 2922 Kb)
- Chapter 10 (Word - 128 Kb)
- Attachment tables (XLSX - 690 Kb)
- Overcrowding in housing
- Rates of disease associated with poor environmental health
- Access to clean water and functional sewerage and
- electricity services
Chapter 11: Safe and supportive communities
- Chapter 11 and attachments (PDF - 2042 Kb)
- Chapter 11 (Word - 170 Kb)
- Attachment tables (XLSX - 1477 Kb)
- Alcohol consumption and harm
- Drug and other substance use and harm
- Juvenile diversions
- Repeat offending
- Community functioning
Chapter 12: Outcomes for Torres Strait Islander people
- Chapter 12 and attachments (PDF - 695 Kb)
- Chapter 12 (Word - 60 Kb)
- Attachment tables (XLSX - 141 Kb)
- Selected outcomes for Torres Strait Islander people
- Attachment tables
- References
Chapter 13: Measuring multiple disadvantage
- Chapter 13 and attachments (PDF - 975 Kb)
- Chapter 13 (Word - 151 Kb)
- Attachment tables (XLSX - 204 Kb)
- Patterns of disadvantage
- Recent research into multiple disadvantage
- References
Appendix 1: COAG Communiques
Appendix 2: Implementation of the framework
Appendix 3: Indigenous population and language use
Appendix 4: Data limitations
Appendix 5: Data sources
The purpose of these fact sheets is to highlight and summarise important material within the Overcoming Indigenous Disadvantage report. To understand the information in the report, it is important to consider the factors that have affected the outcomes being measured.
Fact sheet 1: Key indicators and trends
Download this fact sheet
Trends in national outcomes for Aboriginal and Torres Strait Islander Australians

How have trends in outcomes been assessed?
The figure on the next page summarises changes in outcomes over time. The following approach was taken to assessing change over time:
- The key consideration was change over time in outcomes for Aboriginal and Torres Strait Islander Australians NOT the gap to non-Indigenous Australians. It is important to acknowledge improvements in outcomes for Aboriginal and Torres Strait Islander Australians, even if improvements for non-Indigenous Australians mean that the gap has not narrowed.
- Change has been assessed by comparing latest available data to earliest available data for each indicator. Therefore, the time period may be different for different indicators.
- If apparent change was not statistically significant this was recorded as no change.
- The focus has been on the main measure/s identified for each indicator. Supplementary measures for some indicators may show different trends.
- No trend has been identified where it is not clear whether an observed change in the main measure is positive or negative, or where improvements to data collections have created a break in series.
Results have been summarised into the following five categories:
- progress - where the main measure for an indicator shows outcomes for Aboriginal and Torres Strait Islander Australians improving over time
- no significant change - where the main measure for an indicator shows no meaningful change in outcomes for Aboriginal and Torres Strait Islander Australians
- regress - where the main measure for an indicator shows a decline in outcomes for Aboriginal and Torres Strait Islander Australians
- data gap - where no suitable trend data are available (this does not include indicators where improvements to data collections have created a break in series, which are labelled 'unclear')
- unclear - where it is not clear whether an observed change in the main measure is positive or negative, or where improvements to data collections have created a break in series. Results should be considered in the light of the contextual material in the relevant section of the report.
There are 52 indicators in this report. However, one indicator (5.4 Case studies in governance) is not designed to include quantitative measures.
Fact sheet 2: Measuring the wellbeing of Aboriginal and Torres Strait Islander Australians
Download this fact sheet
Measuring the wellbeing of Aboriginal and Torres Strait Islander Australians
The Overcoming Indigenous Disadvantage (OID) report measures the wellbeing of Aboriginal and Torres Strait Islander Australians and this factsheet aims to provide a snapshot of reporting in this area.
The OID report provides information about a range of health, education, justice and economic outcomes, all of which affect wellbeing in some way. However, Aboriginal and Torres Strait Islander Australians have identified a number of other factors that are particularly important to their conception of wellbeing.
Aboriginal and Torres Strait Islander concepts of wellbeing in the OID report
The OID report includes the following indicators around culture and wellbeing:
- Valuing Indigenous Australians and their cultures - mutual respect between Indigenous and non-Indigenous Australians (section 5.1 in the main report)
- Participation in decision making - a key part of self-determination (section 5.2 in the main report).
- Engagement with services - both access to services and culturally appropriate delivery (section 5.3 in the main report)
- Indigenous language revitalisation and maintenance - an important cultural signifier for many Aboriginal and Torres Strait Islander Australians (section 5.5 in the main report).
- Indigenous cultural studies - educating all students about Australia's Indigenous peoples and cultures (section 5.6 in the main report)
- Participation in community activities - including cultural activities (section 5.7 in the main report)
- Access to traditional lands and waters - can provide physical, spiritual, emotional and cultural benefits (section 5.8 in the main report)
- Community functioning - ability and freedom of community and members to determine the context of their lives and translate their capabilities into positive actions (section 11.5 in the main report).
This fact sheet summarises information about a selection of these indicators from the OID report Overview. The main report includes more detailed information.
Valuing Indigenous Australians and their cultures
Valuing of cultures
In 2012, four out of five people in the general community regarded Aboriginal and Torres Strait Islander culture and history as important, and half reported feeling personally proud of Aboriginal and Torres Strait Islander culture.
Knowledge of cultures
While four out of five Aboriginal and Torres Strait Islander Australians rated their knowledge of Aboriginal cultures as 'high' fewer than one in three people in the general community did.
Indigenous language revitalisation and maintenance
Learning the language
In 2008, around one in ten (11 per cent) Aboriginal and Torres Strait Islander Australians of Aboriginal and Torres Strait Islander Australians aged 3 years and over were learning an Indigenous language, with the proportion highest for the youngest age group (19 per cent for 3-14 year olds).
Spoke the language
In 2008, 17 per cent of Aboriginal and Torres Strait Islander Australians aged 15 years and over spoke an Indigenous language, with the proportion highest in remote areas (49 per cent).
Proportions of Indigenous people learning and speaking Indigenous language, 2008

Indigenous cultural studies
Taught culture
In 2008, almost two-thirds of Aboriginal and Torres Strait Islander 5-24 year olds reported being taught Indigenous culture as part of their studies. Data is not available to provide a comparator for non-Indigenous Australians.
Things that work - case studies
The OID report includes case studies of programs that are making a difference for Aboriginal and Torres Strait Islander Australians. Some of the wellbeing case studies are summarised below.
National Indigenous Television (NITV)
- A free to air channel that aims to inform, entertain and educate Aboriginal and Torres Strait Islander and non-Indigenous audiences.
- As noted in a Productivity Commission report into broadcasting in 2000, Indigenous radio and television helps to sustain language and culture; provide a vital channel of information for Aboriginal and Torres Strait Islander Australians; and can facilitate better communication between Aboriginal and Torres Strait Islander and non-Indigenous Australians.
- A positive 2009 review resulted in continued Australian Government funding to the broadcaster. The 2009 review was endorsed by a further review in 2010, which also made a number of recommendations to enhance the broadcaster's operations.
Australian Electoral Commission's Indigenous electoral participation program
- This program aims to empower Aboriginal and Torres Strait Islander Australians to exercise their right to vote.
- A 2011 evaluation found that the program's early results were positive: '[it] has a significant role to play in addressing the barriers to participation of Indigenous people in democratic processes'.
Yiriman Project (Kimberly region, WA)
- The 2012 Indigenous Governance Awards report noted that: The project 'takes young people and elders on trips back to country to immerse them in the stories, songs and knowledge that are their cultural heritage.'
- Outcomes include the healing of young people as they walk on country, and meaningful employment that values and maintains culture.
- Builds on young people's confidence and improves their self-worth, and is considered to have helped curb suicide, self-harm and substance abuse.
Cape York Welfare Reform (CYWR)
- Reforms that aim to change social norms and behaviours across the areas of social responsibility, education, housing and economic opportunities.
- The 2012 CYWR evaluation report found that 'overall there is clear evidence that the wellbeing of residents in the four CYWR communities (Aurukun, Coen, Hope Vale and Mossman Gorge) has improved over the CYWR years. Crime rates are down, infrastructure and services have improved, school attendance has risen or been maintained at high levels, and people appear happier. In no major dimension have outcomes deteriorated in these communities.'
Fact sheet 3: Aboriginal and Torres Strait Islander men and women
Download this fact sheet
Aboriginal and Torres Strait Islander men and women
The Overcoming Indigenous Disadvantage (OID) report measures the wellbeing of Aboriginal and Torres Strait Islander Australians.
This fact sheet includes selected measures from the strategic framework of indicators in the OID report where data are available and reported by sex and where there are notable differences between men and women. Similar to the total population, approximately half of the Aboriginal Torres Strait Islander population were females and half were males.
Education and training
A greater proportion of females with a Certificate III or studying
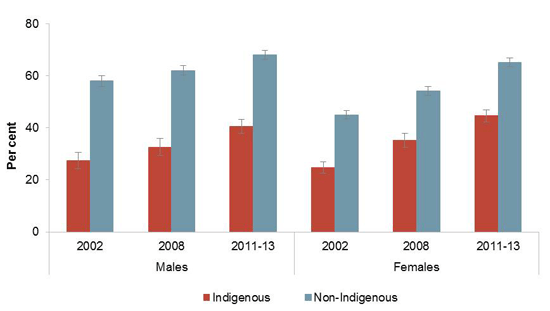
In 2011-13, for Aboriginal and Torres Strait Islander people aged 20-64 years, 45 per cent of females and 41 per cent of males had a Certificate III or higher or were studying - an increase for both females and males from 2002. For the non-Indigenous population males have slightly higher rates than females (68 per cent compared to 65 per cent).
Proportion of 20-64 year olds with a post school qualification of Certificate level III or above or studying
Females have greater success in higher education
For both Aboriginal and Torres Strait Islander and non Indigenous students, females had greater higher education success rates than male students across all years (2001 to 2012).
In 2012, the higher education success rate for Aboriginal and Torres Strait Islander female students was 74 per cent compared to 70 per cent for males.
Employment and Income
More males in the labour force and in employment
In 2012-13, for the Aboriginal and Torres Strait Islander population aged 15-64 years:
- 68 per cent of males were in the labour force compared to 53 per cent of females. This gap was similar for non-Indigenous Australians in 2011-12, though with higher rates (86 per cent for males compared to 74 per cent for females)
- 53 per cent of males were employed compared to 42 per cent of females. This gap was similar for non-Indigenous Australians in 2011-12, though with higher rates (82 per cent for males compared to 71 per cent for females).
Males had higher incomes
In 2012-13, for Aboriginal and Torres Strait Islander people aged 18-64 years, median personal incomes were higher for males than females across all age categories (except for the 18-24 years age group).
Median personal incomes for non-Indigenous people were consistently higher than for Aboriginal and Torres Strait Islander people, and followed the same trend with higher incomes for males than females across all age categories.
Life expectancy and healthy lives
Females live longer than males
From 2005-2007 to 2010-2012, life expectancy at birth for Aboriginal and Torres Strait Islander Australians increased from 67.5 years to 69.1 years for males and from 73.1 years to 73.7 years for females. Life expectancy for non-Indigenous Australians is higher but the gap has narrowed since 2005-2007 for both males and females.
Higher rates of avoidable death and suicide for males
Aboriginal and Torres Strait Islander males had higher rates of avoidable mortality than females across all age categories (except for the 1-4 year age group), with the rates for males aged 15-24 and 25-34 years more than twice the rates for females of the same ages.
For 2008-2012, the rate of deaths from suicide was higher for males than for females for both Aboriginal and Torres Strait Islander Australians (2.9 times as high) and non-Indigenous Australians (3.4 times as high).
Females more likely to be obese
In 2012-13, for Aboriginal and Torres Strait Islander Australians similar rates of males and females (around 70 per cent) were considered to be overweight or obese (also similar for non-Indigenous males - non-Indigenous females had a lower rate). Rates of overweight were higher for males (32 per cent) than females (27 per cent), but rates of obesity were higher for females (43 per cent) than for males (36 per cent).
Imprisonment, detention and victims of assault
Higher rates of imprisonment for males but rates for females growing faster
As at 30 June 2013:
- Aboriginal and Torres Strait Islander adults were imprisoned at 13 times the rate for non-Indigenous adults
- for Aboriginal and Torres Strait Islander adults, the imprisonment rate for males was more than 10 times the rate for females
- though from a lower base, the female imprisonment rate was growing faster (a 74 per cent increase since 2000, compared with a 39 per cent increase for males)
- the male imprisonment rate has slowed in recent years (a 6 per cent increase since 2008).
More males in youth detention and community based supervision
In 2012-13, for Aboriginal and Torres Strait Islander youth aged 10-17 years, there was a daily average of:
- 1975 youth supervised in the community (1557 males and 419 females), compared with 2506 non-Indigenous youth (2056 males and 449 females). The number of males was between 3 and 5 times the number of females.
- 454 youth in detention (409 males and 47 females), compared with 329 non Indigenous youth (294 males and 35 females). The number of males was more than 8 times the number of females.
Women experience physical assault and sexual assault at higher rates
Both Aboriginal and Torres Strait Islander and non-Indigenous women experience physical assault and sexual assault at higher rates than men.
In 2013, both Aboriginal and Torres Strait Islander and non-Indigenous women (in NSW, SA and the NT) reported violence by a current or previous partner at between 1.7 and 6.7 times the rate for men, and reported sexual assault at between 3.3 and 7.8 times the rate for men.
In 2011-12, for Aboriginal and Torres Strait Islander Australians, a domestic altercation was the motive for 83 per cent of female homicides and 23 per cent of male homicides.
Things that work - case studies
The OID report includes case studies of programs that are making a difference for Aboriginal and Torres Strait Islander Australians. Some of the case studies relating specifically to men or women or initiated by women are summarised below. The main report includes more detailed information.
The Alice Springs Domestic and Family Violence Outreach Service (NT)
- The service provides targeted support to women experiencing domestic and family violence. Their annual report noted that in 2012-13, almost 400 women were assisted, with around 80 per cent identified as Aboriginal.
- A 2012-13 evaluation found that all of the 19 women interviewed reported their safety had improved. Almost half of the women who had previously used the crisis accommodation services had not used crisis accommodation since receiving outreach services.
The NPY Women's Council
- The Council (2012 Indigenous Governance Awards Winner - incorporated organisations) is a major provider of human services in the Ngaanyatjarra, Pitjantjatjara and Yankunytjatjara (NPY) lands.
- The Council's accomplishments include banning take-away alcohol sales at Curtin Springs roadhouse and the introduction of non-sniffable Opal fuel in Central Australia.
The Fitzroy Crossing Liquor Restriction (Kimberley region, WA)
- Following representations from local women, in 2007 the WA Director of Liquor Licensing imposed restrictions on the supply of alcohol into the community.
- A 2008-2009 independent evaluation by the University of Notre Dame involving interviews (with 184 people) and analysis of police data found positive effects on domestic violence, public violence and antisocial behaviour, and an increase in families purchasing food and clothes.
Coonamble Sports Mentoring Program (North-west NSW)
- The program aims to teach life skills to 12-18 year old males, through sports-based mentoring by adults at local sporting clubs.
- Although the program is small scale, and has not yet been independently evaluated, a 2009 review found that, in the first year of the project, the 15 participants showed 'increased social, emotional and relationship development' and 'skills and motivation to achieve their goals'. Reports from school coordinators in the following year stated that 14 participants either remained in school or gained employment in the following year, 'a figure previously unheard of in this area'.
This fact sheet summarises information about a selection of indicators from the OID report. The overview and main report include more detailed information.
Fact sheet 4: Aboriginal and Torres Strait Islander young children
Download this fact sheet
Aboriginal and Torres Strait Islander young children
The Overcoming Indigenous Disadvantage (OID) report measures the wellbeing of Aboriginal and Torres Strait Islander Australians.
This fact sheet includes selected measures from the strategic framework of indicators in the OID report that are particularly relevant to Aboriginal and Torres Strait Islander young children - children aged less than five years.
Children aged under 5 years
Relatively young population
12 per cent of the Aboriginal and Torres Strait Islander population are aged under 5 years, compared with 6 per cent of the non-Indigenous population.
Young child mortality
Decline in death rates
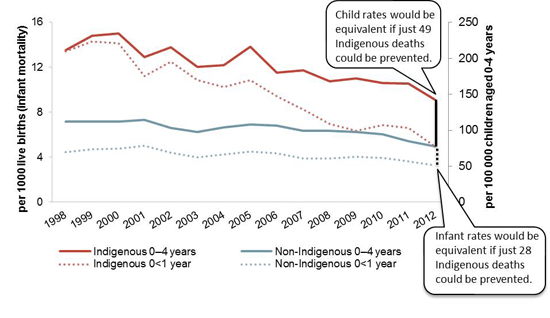
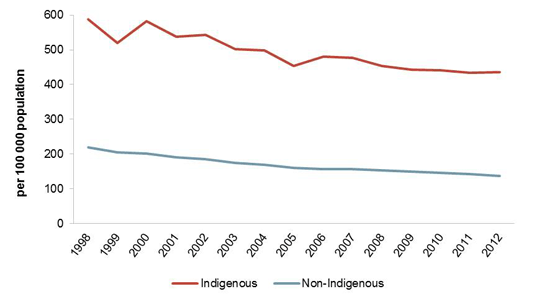
From 1998 to 2012, there was a significant decline in mortality rates for Aboriginal and Torres Strait Islander children aged 0-4 years (from 217 to 146 deaths per 100 000 population), with the greatest decrease for those aged 0<1 year (from 14 to 5 deaths per 1000 live births). In 2012, infant mortality accounted for three-quarters of all deaths of children aged 0-4 years.
Child (aged 0-4 years) and infant (aged 0<1 year) mortality rates, NSW, Queensland, WA, SA and the NT, 1998 to 2012
Leading causes of death
Up to half of all child deaths were issues related to pregnancy or birth
For 2008-2012, the leading cause of death for both Aboriginal and Torres Strait Islander children and non-Indigenous children was complications of pregnancy, labour and delivery, disorders related to fetal growth and respiratory and cardiovascular and other disorders specific to the perinatal period - accounting for almost half of all deaths for those under 1 year and around 40 per cent of all deaths of those under 5 years.
Once the infancy period has passed, the leading cause of death for children aged 1-4 years is injury and poisoning.
Early child development
Antenatal care
Half of all Aboriginal and Torres Strait Islander women who gave birth in 2011 attended at least one antenatal visit in the first trimester and 85 per cent attended five or more antenatal visits.
Aboriginal and Torres Strait Islander mothers attended their first antenatal visit later in pregnancy than non-Indigenous mothers and attended less frequently.
Time series data are limited but gaps in antenatal care attendance rates narrowed in some states and territories between 2007 and 2011.
Health behaviours during pregnancy
Nationally (excluding Victoria), the proportion of Aboriginal and Torres Strait Islander mothers who smoked during pregnancy decreased from 55 per cent in 2005 to 51 per cent in 2011.
The smoking rate for Aboriginal and Torres Strait Islander mothers during pregnancy was four times the rate for non-Indigenous mothers.
Birthweight
For NSW, Victoria, Queensland, WA, SA and the NT combined, the proportion of low birthweight babies born to Aboriginal and Torres Strait Islander mothers decreased from 12 per cent in 2000 to 11 per cent in 2011. This compares to 5 per cent for non Indigenous mothers in 2011.
Early child education
Providing children with a head start
In 2013, for Aboriginal and Torres Strait Islander children in the year before full time schooling:
- 74 per cent were enrolled in preschool
- 70 per cent were attending preschool, with attendance highest in remote/very remote areas (75 per cent).
This compares to 91 per cent enrolment and 89 per cent attendance for non-Indigenous children.
Things that work - case studies
The OID report includes case studies of programs that are making a difference for Aboriginal and Torres Strait Islander Australians. Some of the early child development case studies are summarised below. The main report includes more detailed information.
Aboriginal Midwifery Access program (ACT)
- The program provides culturally appropriate midwifery services to parents and newborns and has encouraged more Aboriginal women to visit midwives at an early stage of pregnancy.
- A 2011 evaluation found the service was a benchmark program for parents and newborns.
Aboriginal Maternal and Infant Health Service (NSW)
- The service has improved health outcomes for Aboriginal mothers and babies by providing culturally appropriate maternity care, including secondary programs on mental health, drug and alcohol, and Quit for Life Smoking cessation in pregnancy.
- A 2012 evaluation found an increase in women receiving antenatal care before 20 weeks gestation, and a reduction in pre-term births.
Healthy for Life program (national)
- The program focuses on continuous quality improvement in maternal health, child health and chronic disease, with measured increases in birthweight for participating Aboriginal Community Controlled Health Services.
- An evaluation found that, over the year to June 2008, there was a decrease in the proportion of low birthweight babies and an increase in the proportion of high birthweight babies. More recent data found an increase in the proportion of normal birthweight babies from 82 per cent in 2007-08 to 84 per cent in 2010-11.
Care for Kids' Ears initiative (national)
- The initiative aims to increase awareness of ear disease and hearing loss in Aboriginal and Torres Strait Islander communities.
- An evaluation (by the Cultural and Indigenous Research Centre Australia) over the two years to June 2013 found the campaign had a positive impact on awareness of ear health. Those exposed to the campaign were more likely than those who weren't to identify at least one prevention action unprompted (74 per cent compared to 51 per cent) and were more likely to have their children's ears checked in the previous 12 months when they did not have any signs or symptoms (70 per cent compared to 44 per cent).
This fact sheet summarises information about a selection of indicators from the OID report. The overview and main report include more detailed information, and provide information about a range of health, education, justice and economic outcomes, and indicators of wellbeing and culture, all of which affect children in some way.
Fact sheet 5: Measuring outcomes across remoteness areas
Download this fact sheet
Measuring outcomes across remoteness areas
The Overcoming Indigenous Disadvantage (OID) report measures the wellbeing of Aboriginal and Torres Strait Islander Australians.
This fact sheet includes selected measures from the strategic framework of indicators in the OID report where data are available and reported by remoteness and where there are notable differences between areas.
Where does Australia's population live?
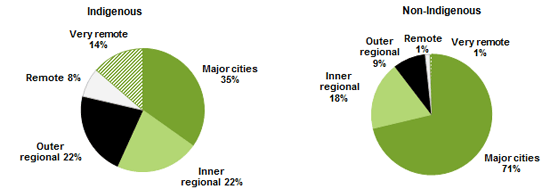
As at 30 June 2011, most Aboriginal and Torres Strait Islander Australians lived in major cities or regional areas, but significant proportions lived in more remote areas.
Many outcomes worsen as remoteness increases
Less engagement with services
In 2008, nearly half of Aboriginal and Torres Strait Islander Australians in very remote areas reported having problems accessing services in the previous year, for example, dentists (33 per cent), hospitals (19 per cent), banks and doctors (each 14 per cent) and legal services (12 per cent).
Indigenous people aged 15 years and over who had problems accessing services, 2008
Poorer learning outcomes
In 2013, 18 to 55 per cent of Aboriginal and Torres Strait Islander students achieved national minimum standards in reading, writing and numeracy (years 3, 5, 7 and 9) in very remote areas, compared with 60 to 91 per cent achieving the standards in metropolitan areas. Proportions for non-Indigenous students were consistently higher, and did not show the same degree of variation by remoteness.
Lower school completion rates
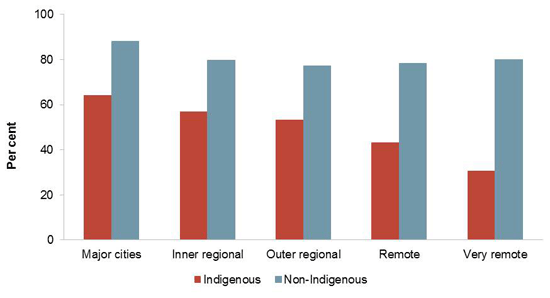
In 2011, the proportion of Aboriginal and Torres Strait Islander Australians aged 20−24 years who had completed year 12 or above ranged from 64 per cent in major cities down to 31 per cent in very remote areas. Proportions for non-Indigenous Australians were consistently higher, and did not show the same degree of variation by remoteness.
Proportion of 20-24 year olds who had completed year 12 or certificate II or above, 2011
Smoking rates increase
In 2012-13, smoking rates for Aboriginal and Torres Strait Islander adults were higher in very remote areas (55 per cent) and remote areas (49 per cent) than major cities (40 per cent).
Lower home ownership rates
In 2012-13, the proportion of Aboriginal and Torres Strait Islander adults who lived in a home owned by a member of their household decreased as remoteness increased (from 38 per cent in major cities to 5 per cent in very remote areas).
Some outcomes improve as remoteness increases
Lower levels of high/very high psychological distress
In 2012-13, the proportion of Aboriginal and Torres Strait Islander adults experiencing high/very high levels of psychological distress was higher in major cities and regional areas (around 32 per cent) than remote areas (around 23 per cent). Rates for non-Indigenous adults were similar across remoteness areas (around 11 per cent in 2011-12).
More people speaking an Indigenous language and taught culture
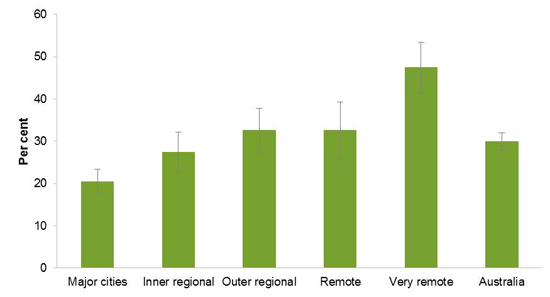
In 2008, almost half (49 per cent) of Aboriginal and Torres Strait Islander Australians aged 3 years and over in remote areas spoke an Indigenous language compared to 7 per cent in other areas.
Aboriginal and Torres Strait Islander Australians aged 15 years and over in remote areas were more likely to have been taught Aboriginal and Torres Strait Islander culture at school or as part of further studies compared to other areas (52 per cent compared to 44 per cent).
The bigger picture
The majority of Aboriginal and Torres Strait Islander Australians do not live in remote areas. Regardless of location, on average, their outcomes are poorer than those of non-Indigenous Australians.
Aboriginal and Torres Strait Islander Australians in cities and large regional towns are concentrated in neighbourhoods with low socioeconomic outcomes and tend to have poorer outcomes than non-Indigenous Australians in those same neighbourhoods.
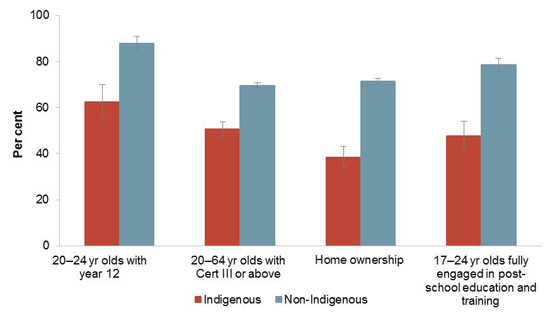
Selected outcomes, major cities, 2011-13
This fact sheet summarises information about a selection of indicators from the OID report. The overview and main report include more detailed information. The OID report includes case studies of programs that are making a difference for Aboriginal and Torres Strait Islander Australians.
Case studies are not presented in this factsheet, as although there are programs operating in remote areas these are focused on improving outcomes for specific services rather than geographic areas.
Fact sheet 6: Justice outcomes for Aboriginal and Torres Strait Islander Australians
Download this fact sheet
Justice outcomes for Aboriginal and Torres Strait Islander Australians
The Overcoming Indigenous Disadvantage (OID) report measures the wellbeing of Aboriginal and Torres Strait Islander Australians.
This fact sheet includes selected measures from the strategic framework of indicators in the OID report relating to crime and justice for Aboriginal and Torres Strait Islander Australians.
Youth diversion and youth detention
Diversion from the justice system can reduce negative effects
Diversion of young offenders from the criminal justice system can be a swift and economically efficient response to offending, by reducing the negative effects of contact with other offenders and the negative labelling and stigmatisation.
Rates of diversion from formal criminal justice processes for Aboriginal and Torres Strait Islander young people aged 10-17 years are around one-half to two-thirds those for non-Indigenous young people, and have remained relatively unchanged over recent years.
Detention is considered a last resort for youth
Detention is considered a last resort for youth. In 2012-13, for Aboriginal and Torres Strait Islander youth aged 10-17 years, there was a daily average of:
- 1975 youth supervised in the community, compared with 2506 non-Indigenous youth (around 14 times the rate for non-Indigenous youth)
- 454 youth in detention, compared with 329 non-Indigenous youth (around 24 times the rate for non-Indigenous youth).
Adult imprisonment
The majority never commit criminal offences
In 2008, two-thirds of Aboriginal and Torres Strait Islander Australians aged 15 years or over reported never being formally charged by police.
However, compared to non-Indigenous Australians, Aboriginal and Torres Strait Islander Australians experience much higher rates of contact with the criminal justice system as both victims and offenders.
For the population that end up in prison, around 1 in 4 are Indigenous
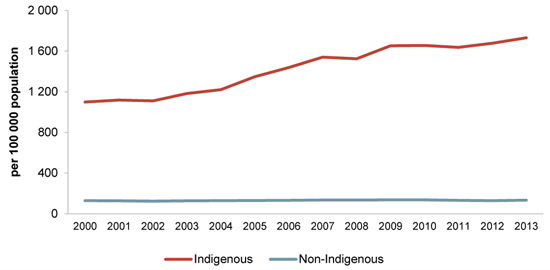
Aboriginal and Torres Strait Islander Australians made up over a quarter (27 per cent) of the adult prison population on 30 June 2013, but only 2.3 per cent of the adult population.
Rates are increasing and the gap is widening
Aboriginal and Torres Strait Islander adults were imprisoned at 13 times the rate for non-Indigenous adults. From 2000 to 2013, the imprisonment rate for Aboriginal and Torres Strait Islander adults increased by 57 per cent, while the non-Indigenous rate remained fairly constant.
Age standardised adult imprisonment rate, at 30 June
Relatively young prisoner population
Around 46 per cent of Aboriginal and Torres Strait Islander prisoners were aged under 30 years, and half of these prisoners were under 24 years. The median age of Aboriginal and Torres Strait Islander prisoners at 30 June 2013 was 31 years, 4 years lower than the median age for non-Indigenous prisoners (35 years).
Largely sentenced for acts intended to cause injury
Of all Aboriginal and Torres Strait Islander prisoners, the largest proportion had been sentenced for acts intended to cause injury (30 per cent), whereas the largest proportions of non-Indigenous prisoners had been sentenced for illicit drug offences (15 per cent) and sexual assault and related offences (14 per cent).
Repeat offending and re-incarceration
Three-quarters of prisoners had a known prior imprisonment
Repeat offending and re-incarceration are significant contributors to the over-representation of Aboriginal and Torres Strait Islander Australians in the youth justice and criminal justice systems.
In 2012-13, 40 to 47 per cent of Aboriginal and Torres Strait Islander offenders were proceeded against by police on more than one occasion, compared with 20 to 28 per cent of non-Indigenous offenders.
On 30 June 2013, 77 per cent of Aboriginal and Torres Strait Islander prisoners had a known prior imprisonment, compared with 51 per cent of non-Indigenous prisoners.
Family and community violence
1 in 4 adults reported being a victim of violence
Family violence has a significant impact on the short-term and long-term health and welfare of individuals, families and communities.
In 2008, around 23 per cent of Aboriginal and Torres Strait Islander adults reported being a victim of physical or threatened violence — similar to the rate in 2002. After adjusting for differences in population age structures, this was 2.2 (in 2002) and 1.8 (in 2008) times the rate for non-Indigenous adults, reflecting an increase in the non-Indigenous rate over this period.
Hospitalisation rates for family violence are 25-33 times those for other Australians
Between 2004-05 and 2012-13, hospitalisation rates for family violence-related assault for Aboriginal and Torres Strait Islander Australians were between 25 and 33 times the rates for other Australians. However, these rates are likely to underestimate the true extent of family violence as not all victims seek medical attention and not all hospitalisations resulting from family violence will be recorded as such.
Alcohol is a significant contributor to violence
Alcohol stands out as a significant contributor to violence in Aboriginal and Torres Strait Islander communities.
In 2011-12, the proportion of Aboriginal and Torres Strait Islander homicides involving both the victim and offender having consumed alcohol at the time of the offence (79 per cent — 15 out of 19) was higher than the proportion for non-Indigenous homicides (15 per cent — 17 out of 115).
Things that work — case studies
The OID report includes case studies of programs that are making a difference for Aboriginal and Torres Strait Islander Australians. Justice related case studies are summarised below. The main report includes more detailed information.
Alice Springs Domestic and Family Violence Outreach Service (NT)
- The service provides targeted support to women experiencing domestic and family violence. In 2012-13, almost 400 women were assisted, with around 80 per cent identified as Aboriginal.
- A 2012-13 evaluation found that all of the 19 women interviewed reported their safety had improved. Almost half of the women who had previously used the crisis accommodation services had not used crisis accommodation since receiving outreach services.
Magistrates Early Referral into Treatment drug diversion program (NSW)
- A tailored, case management program that diverts adult defendants in local courts with demonstrable drug problems to an intensive three-month drug treatment program. Aboriginal and Torres Strait Islander defendants make up around 18 per cent of the program participants.
- A 2009 evaluation found that, compared with similar defendants who did not participate in the program, completion of the program reduced reoffending by 12 per cent over a two-year follow up period.
This fact sheet summarises information about a selection of indicators from the OID report. The overview and main report include more detailed information, and provide information about a range of health, education and economic outcomes, and indicators of wellbeing and culture, all of which affect crime and justice outcomes.
Fact sheet 7: Health outcomes for Aboriginal and Torres Strait Islander Australians
Download this fact sheet
Health outcomes for Aboriginal and Torres Strait Islander Australians
The Overcoming Indigenous Disadvantage (OID) report measures the wellbeing of Aboriginal and Torres Strait Islander Australians.
This fact sheet includes selected measures from the strategic framework of indicators in the OID report on health outcomes for Aboriginal and Torres Strait Islander Australians.
Life expectancy has improved
People are living longer
From 2005-07 to 2010-12 life expectancy at birth for Aboriginal and Torres Strait Islander Australians increased:
- from 67.5 years to 69.1 years for males
- from 73.1 years to 73.7 years for females.
The gap between Aboriginal and Torres Strait Islander Australians and non-Indigenous Australians has narrowed:
- from 11.4 years to 10.6 years for males
- from 9.6 years to 9.5 years for females.
Death rates have declined
From 1998 to 2012:
- Aboriginal and Torres Strait Islander mortality rates declined from 449 to 409 deaths per 100 000 population (around 9 per cent), with the gap to non-Indigenous Australians narrowing.
- for avoidable deaths, the rate for Aboriginal and Torres Strait Islander people aged 0-74 years declined by 27 per cent, though it was still three times the rate for non-Indigenous Australians.
Mortality rates for potentially avoidable deaths, people aged 0-74 years, 1998 to 2012
Other health outcomes are concerning
Rates of disability remain high
In 2012, the rate of disability among Aboriginal and Torres Strait Islander Australians was 23 per cent - similar to 2009 (21 per cent). The disability rate among Aboriginal and Torres Strait Islander Australians was 1.7 times the rate for non-Indigenous Australians.
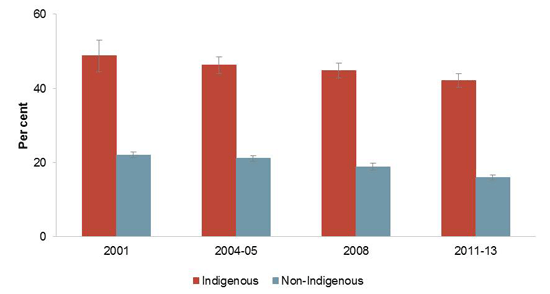
Mental health outcomes have worsened
In 2011-13, 30 per cent of Aboriginal and Torres Strait Islander adults reported high/very high levels of psychological distress (three times the rate for non-Indigenous adults), an increase from 27 per cent in 2004-05.
Suicide rates higher for younger people
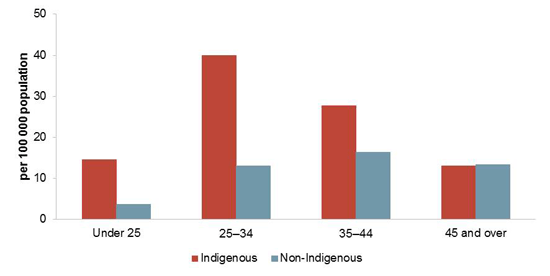
Suicide death rates for Aboriginal and Torres Strait Islander Australians in 2008-2012 were almost twice the rate for non-Indigenous Australians. Rates varied by age, with the highest rate for those aged 25-34 years, around three times the rate for non-Indigenous Australians.
Deaths rates from suicide by age, 2008-2012
Lifestyle factors play a major role
Smoking rates have declined
The proportion of Aboriginal and Torres Strait Islander adults smoking decreased from 51 to 44 per cent between 2001 and 2011-13. A decrease in rates for non-Indigenous Australians too, means the gap has remained around 26 percentage points.
Rates of current daily smokers aged 18 years and over, 2001 to 2011-13
7 in 10 adults are overweight or obese
In 2011-13, 69 per cent of Aboriginal and Torres Strait Islander adults were overweight or obese (around 1.2 times the rate for non-Indigenous adults). Comparable time series data are not available due to improved measurement for this indicator.
1 in 5 adults drink at levels exceeding lifetime risk guidelines
In 2011-13, for Aboriginal and Torres Strait Islander adults:
- 20 per cent reported exceeding lifetime alcohol risk guidelines (similar to non-Indigenous adults, and similar to 2004-05 rates).
- 57 per cent reported exceeding single occasion risk guidelines (around 1.1 times the rate for non-Indigenous adults).
Improvements for child health
Fact sheet #4 on young children contains more detail on various OID indicators for which data on children are available.
Health behaviours during pregnancy are improving
Nationally, the proportion of Aboriginal and Torres Strait Islander mothers who smoked during pregnancy decreased from 55 per cent in 2005 to 51 per cent in 2011.
The proportion of Aboriginal and Torres Strait Islander mothers who had low birthweight babies decreased from 12 per cent in 2000 to 11 per cent in 2011 (NSW, Victoria, Queensland, WA, SA and the NT).
Whilst time series data for antenatal care are not available, recent data shows that Aboriginal and Torres Strait Islander mothers attended their first antenatal visit later in pregnancy than non-Indigenous mothers and attended less frequently.
Decline in death rates for children
From 1998 to 2012, there was a significant decline in mortality rates for Aboriginal and Torres Strait Islander children aged less than 5 years (from 217 to 146 deaths per 100 000 population), with the greatest decrease for those aged less than 1 year (from 14 to 5 deaths per 1000 live births).
Decline in rates of hearing conditions for children
The proportion of Aboriginal and Torres Strait Islander 0-14 year olds with a hearing condition decreased from 11 per cent in 2001 to 7 per cent in 2012-13 (twice the rate for non-Indigenous children).
Things that work - case studies
The OID report includes case studies of programs that are making a difference for Aboriginal and Torres Strait Islander Australians. Some of the health related case studies are summarised below.
Case studies relate mainly to children. There are limited evaluations of health programs for the broader population.
Aboriginal Midwifery Access (ACT)
The program provides culturally appropriate midwifery services to parents and newborns, and encourages women to visit midwives at an early stage of pregnancy. A 2011 evaluation found the service was a benchmark program for parents and newborns.
Aboriginal Maternal and Infant Health Service (NSW)
The service has improved health outcomes for Aboriginal mothers and babies by providing culturally appropriate maternity care, including secondary programs on mental health, drugs and alcohol, and Quit for Life Smoking cessation in pregnancy. A 2012 evaluation found an increase in women receiving antenatal care before 20 weeks gestation, and a reduction in pre-term births.
Healthy for Life (national)
The program focuses on continuous quality improvement in maternal and child health and chronic disease. An evaluation found that over the year to June 2008, there was a decrease in the proportion of low birthweight babies and an increase in the proportion of high birthweight babies. More recent data found and increase in the proportion of normal birthweight babies from 82 to 84 per cent (2007-08 to 2010-11).
Care for Kids' Ears (national)
The initiative aims to increase awareness of ear disease and hearing loss in Aboriginal and Torres Strait Islander communities. An evaluation over the two years to June 2013 found the campaign had a positive impact on awareness of ear health. Those exposed to the program were more likely than those who were not to identify at least one prevention action unprompted and were more likely to have had their children's ears checked in the previous 12 months when they did not have any signs or symptoms.
Fitzroy Crossing liquor restriction (WA)
The program restricted the supply of alcohol into the community. A 2008-2009 evaluation involving interviews with 184 people, and analysis of police data for the local area, found positive effects on domestic violence, public violence and antisocial behaviour, and an increase in families purchasing food and clothes. The evaluation reported the benefits appeared to reach a high at the mid-point mark of the restrictions (12 months after implementation).
This fact sheet summarises information about a selection of indicators from the OID report. The main report includes more detailed information. The overview and main report provide information about a range of education, justice and economic outcomes, all of which affect health in some way.
Fact sheet 8: Education, training and economic participation of Aboriginal and Torres Strait Islander Australians
Download this fact sheet
Education, training and economic participation of Aboriginal and Torres Strait Islander Australians
The Overcoming Indigenous Disadvantage (OID) report measures the wellbeing of Aboriginal and Torres Strait Islander Australians.
This fact sheet includes selected measures from the strategic framework of indicators in the OID report that are particularly relevant to education, training and economic participation. Whilst some preschool and school outcomes are concerning, other outcomes (such as post-secondary education and some areas of economic participation) are encouraging.
Attendance in early childhood and school education
Lower rates of preschool attendance, but increases with remoteness
In 2013, for Aboriginal and Torres Strait Islander children in the year before full time schooling, enrolment rates ranged from 67 per cent in major cities to 85 per cent in remote/very remote areas. Attendance rates varied similarly, from 65 per cent in major cities to 75 per cent in remote/very remote areas.
This compares to overall 91 per cent enrolment and 89 per cent attendance for non-Indigenous children. Comparable time series data not yet available.
Lower rates of school attendance
In 2013, Aboriginal and Torres Strait Islander students generally had lower attendance rates than non-Indigenous students across school sectors in each State and Territory (difference larger in year 10 than year 5).
School education outcomes
Few improvements in learning outcomes against national minimum standards
In 2013, the proportion of Aboriginal and Torres Strait Islander students achieving at or above the national minimum standard are outlined below.
| Year 3 (%) | Year 5 (%) | Year 7 (%) | Year 9 (%) | |
|---|---|---|---|---|
| Reading | 82 | 83 | 73 | 74 |
| Writing | 79 | 66 | 61 | 51 |
| Numeracy | 82 | 73 | 78 | 66 |
From 2008 to 2013, for reading and numeracy1, improvements were seen for Aboriginal and Torres Strait Islander students in year 3 reading and year 5 reading, with the gap to non-Indigenous students narrowing. There were no changes for year 7 or 9 reading or numeracy.
In 2013, achievement for non-Indigenous students for all subjects and year levels was greater than 90 per cent, with the exception of year 9 writing (84 per cent).
Increase in year 12 attainment
From 2008 to 2012-13, the proportion of Aboriginal and Torres Strait Islander 20-24 year olds who had completed year 12 or equivalent or above increased from 45 to 59 per cent. The non-Indigenous rate remained stable between 86 and 88 per cent.
Post-secondary education
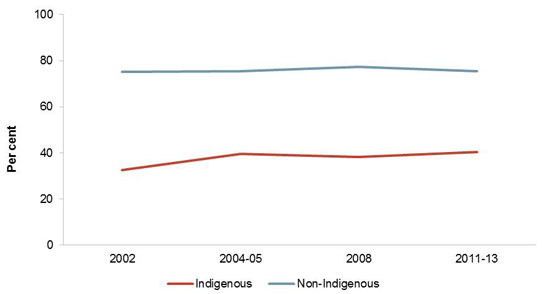
Improvement in transition from school to further education, training or work
The proportion of Aboriginal and Torres Strait Islander 17-24 year olds participating in post-school education, training or employment increased from 32 per cent in 2002 to 40 per cent in 2011-13. The non-Indigenous rate was stable over the period (75 per cent), leading to a narrowing of the gap.
People aged 17-24 years fully engaged in post-school education, training or employment, 2002 to 2011-13
Increase in rates of completion for VET and higher education
In 2013, the national VET pass rate for Aboriginal and Torres Strait Islander students was 75 per cent, an increase from 65 per cent in 2004. Over the same period the rate for non-Indigenous students increased from 79 to 83 per cent.
In 2012, the higher education success rate for Aboriginal and Torres Strait Islander students was 73 per cent, an increase from 65 per cent in 2001. Over the same period the rate for non-Indigenous students remained stable around 87 per cent.
Increase in attainment of higher level skills
In 2012-13, 43 per cent of Aboriginal and Torres Strait Islander Australians aged 20-64 year olds had a Certificate level III or above or were studying, a 17 percentage point increase from 2002. The gap between non-Indigenous Australians remained steady around 25 percentage points.
Economic participation
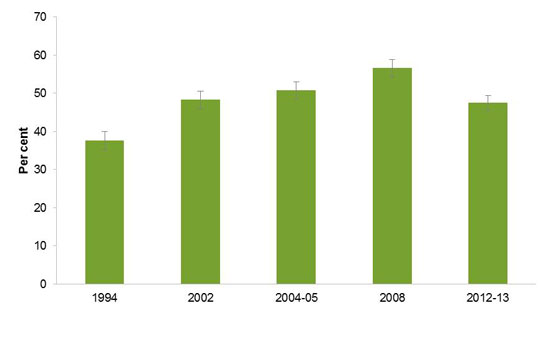
Employment to population ratio increased to 2008 before declining
The proportion of Aboriginal and Torres Strait Islander Australians aged 15-64 years who were employed increased from 38 per cent in 1994 to 54 per cent in 2008 before declining to 48 per cent in 2012-13. The non-Indigenous rate increased from 74 per cent in 2004-05 to 77 per cent in 2011-12.
The decline for Aboriginal and Torres Strait Islander Australians from 2008 to 2012-13 was possibly due to:
- a decrease in the employment rate for males, particularly those aged 15-17 years (a corresponding decrease in labour force participation shows they were not actively looking for work, and may have been in education or training).
- changes in the Community Development Employment Program (CDEP)2 — some participants may have been classified as employed in one period and as unemployed in another period.
Employment to population ratio for Indigenous Australians aged 15-64 years
For those employed, an increase in full time and managerial positions
For employed Aboriginal and Torres Strait Islander Australians:
- the proportion aged 18-64 years who were in full time employment increased from 55 per cent in 2002 to 65 per cent in 2012-13 (around 5 percentage points lower than the proportion for non-Indigenous Australians — 70 per cent in 2011-12)
- the proportion aged 15-64 years who were in professional or managerial positions increased from 16 per cent in 2001 to 20 per cent in 2011 (the proportion for non-Indigenous Australians increased from 33 to 35 per cent)
- the proportion aged 18-64 years who were self-employed was 6 per cent in 2012-13 — stable since 1994. The proportion for non-Indigenous Australians almost halved from 21 per cent in 2001 to 11 per cent in 2011-12.
Reliance on income support has decreased
From 2002 to 2012-13, there were marked decreases in the proportions of Aboriginal and Torres Strait Islander Australians aged 18-64 years whose main source of income was government pensions/allowances and CDEP/other cash income, with the proportion whose main source of income was employee income increasing from 32 to 41 per cent.
Native title coverage has increased
Nationally in 2013, native title had been determined to exist in full or in part in 21 per cent of Australia, up from 5 per cent in 2004 (with proportions highest in very remote areas).
Home ownership has increased
In 2012-13, the proportion of Aboriginal and Torres Strait Islander adults living in a home owned by a member of their household was 30 per cent (72 per cent in 2011-12 for non-Indigenous adults) — an increase from 22 per cent in 1994.
Things that work — case studies
The OID report includes case studies of programs that are making a difference for Aboriginal and Torres Strait Islander Australians. Some of the education, training and economic participation case studies are summarised below. The main report includes more detailed information.
Sporting chance program (national)
- The Sporting Chance Program aims to improve educational outcomes for Aboriginal and Torres Strait Islander students through school-based sports academies in secondary schools, and education engagement strategies for primary and secondary school students.
- A 2010 evaluation found that school staff considered that the program was having a moderate (positive) impact on school engagement (although the degree and nature of improvement varied between schools).
Australian Indigenous Mentoring Experience (national)
- The Australian Indigenous Mentoring Experience program was established in 2005, with university students mentoring Aboriginal and Torres Strait Islander students in years 7 to 12.
- A 2012 evaluation found that the program was effective in strengthening school and post-school aspirations, sense of engagement, and sense of identity. Mentored student outcomes were better than the national average.
Working on Country (national)
- The Working on Country program provides employment and training opportunities to assist Aboriginal and Torres Strait Islander Australians in rural and remote areas to undertake work in natural resource management.
- A 2011 evaluation found that the rangers saw the jobs as 'real jobs' that provided better income and conditions, more interesting work and ongoing employment, than the CDEP alternative.
This fact sheet summarises information about a selection of indicators from the OID report. The overview and main report include more detailed information.
Footnotes
- Data for writing from 2011 onwards are not comparable to prior years due to a change in the type of writing text used. Return to footnote 1
- An employment and training program for Aboriginal and Torres Strait Islander Australians. Return to footnote 2