TARGET 7
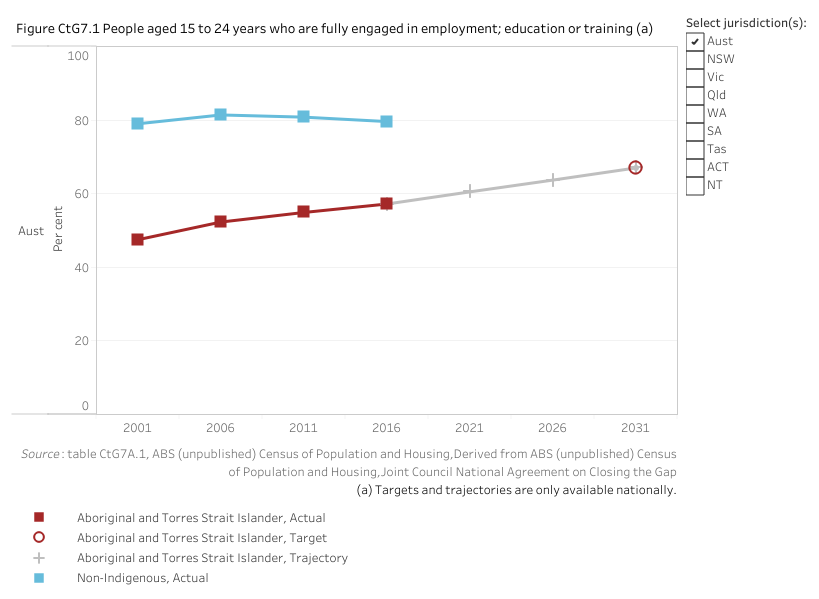
By 2031, increase the proportion of Aboriginal and Torres Strait Islander youth (15-24 years) who are in employment, education or training to 67 per cent
Dashboard snapshot: The data below are the most recent at the time of preparing the July 2021 report. Please go to the dashboard to access the current data.
Nationally in 2016, 57.2 per cent of Aboriginal and Torres Strait Islander people aged 15–24 years were fully engaged in employment, education or training (figure CtG7.1).
There are no new data since the baseline year of 2016.

Target data specifications
Outcome: | Aboriginal and Torres Strait Islander youth are engaged in employment or education. |
|---|---|
Target: | By 2031, increase the proportion of Aboriginal and Torres Strait Islander youth (15-24 years) who are in employment, education or training to 67 per cent. |
Indicator: | The proportion of Aboriginal and Torres Strait Islander youth aged 15-24 years who are fully engaged in employment, education or training. |
Measure: | The measure is defined as: Numerator — number of Aboriginal and Torres Strait Islander people aged 15-24 years who are engaged in full-time work, full-time study and/or full-time training or a combination of work and study and training Denominator — total number of Aboriginal and Torres Strait Islander people in the population aged 15-24 years old and is presented as a percentage. |
Target established: | National Agreement on Closing the Gap July 2020 |
Latest dashboard update: | 23 June 2021 |
Indicator type: | Target |
Interpretation of change: | A high or increasing proportion is desirable. An increase from the baseline year is an improvement. |
Data source: | Name: ABS Census of Population and Housing, Census Table Builder (Basic) Frequency: Five-yearly Documentation (links): www.abs.gov.au/census |
Data provider: | Provider name: Australian Bureau of Statistics Provider area: Census |
Baseline year: | 2016 |
Target year: | 2031 |
Disaggregations: | State and territory and Australia, by Indigenous status |
Computation: | Numerator divided by Denominator multiplied by 100 Counting rules Data are for all Australian residents enumerated in the Census that reported having a usual residence in Australia. Geographical variables are based on a person’s place of usual residence. Includes (both numerator and denominator)
Excludes (both numerator and denominator)
Extraction Census Table Builder (Basic) – Employment, Income and Education: INGP X EEPT (STUP X LFS/HRSP prior to 2016) X Main ASGS (UR) X AGE5P |
Data quality considerations: | Data values have been randomly adjusted using perturbation to avoid the release of confidential data. |
Future reporting: | Additional disaggregations required for future reporting:
|
Supporting indicators
Driver
- Proportion of youth Not Engaged in Employment, Education or Training (NEET)
By disability, long term health condition, caring responsibility, looking for work - Proportion of NEET by main reason for not studying in last 12 months
Contextual information
- For youth engaged in education
• type of educational institution attending (school/ technical and further education/higher education)
• highest education level completed - For youth engaged in employment
• proportion self-employed
• proportion by occupation
• proportion by industry - Proportion not engaged in employment, education or training (NEET)
By highest education level completed - Progress towards parity
