PC News - December 2017
Understanding government expenditure on services to Aboriginal and Torres Strait Islander Australians

The 2017 Indigenous Expenditure Report provides estimates of government expenditure on services provided to Aboriginal and Torres Strait Islander Australians.
The Productivity Commission published the 2017 Indigenous Expenditure Report (IER) – which includes the report, data, data manuals and other material – in October 2017, with all material available at Indigenous Expenditure Report 2017.
The IER provides estimates of Australian, State and Territory government expenditure for Aboriginal and Torres Strait Islander Australians across more than 150 expenditure categories, with data reported for 2008-09, 2010-11, 2012-13 and 2015-16.
What can the estimates tell me?
When combined with other information, such as the Overcoming Indigenous Disadvantage: Key Indicators 2016, the estimates contribute to a better understanding of the adequacy, effectiveness and efficiency of government expenditure on services to Aboriginal and Torres Strait Islander Australians. Expenditure may be compared across all States and Territories, and for Aboriginal and Torres Strait Islander, non-Indigenous and all Australians.
The IER is not able to provide information on whether spending has achieved its desired outcome; to do so would require tracking expenditure from governments to individuals, and then determining the impact of the various expenditures on individuals and associated outcomes. This type of study is best done through evaluation of specific policies and programs, which is outside the scope of the IER.
What were the estimates at an aggregate level?
In 2015-16, total direct government expenditure on Aboriginal and Torres Strait Islander Australians was estimated to be $33.4 billion, a real increase from $27.0 billion in 2008-09. The estimated direct expenditure per person was $44 886 for Aboriginal and Torres Strait Islander Australians, around twice the rate for non-Indigenous Australians ($22 356); a similar ratio to previous years. The higher per person expenditure (difference of $22 530) reflects the combined effects of:
- greater intensity of service use ($14 349 or 63.7 per cent) – because of greater need, and because of the younger age profile of the population
- higher cost of providing services ($8181 or 36.3 per cent) – for example, because of more remote locations, or because targeted services are provided in addition to mainstream services (for example, Indigenous liaison officers in hospitals).
What were the estimates for Indigenous specific and mainstream services?
In 2015-16, Indigenous specific services (targeted expenditure assumed to relate exclusively to Aboriginal and Torres Strait Islander Australians) accounted for 18.0 per cent of direct expenditure on Aboriginal and Torres Strait Islander Australians, a decrease from 22.5 per cent in 2008-09. Mainstream services (expenditure available to all Australians through services and programs – for example, school education) accounted for 82.0 per cent, an increase from 77.5 per cent in 2008-09.
What were the estimates by building block?
Expenditure is disaggregated across six broad areas that relate to the National Indigenous Reform Agreement and OID report building blocks: early child development and education and training; healthy lives; economic participation; home environment; safe and supportive communities; and other government services.
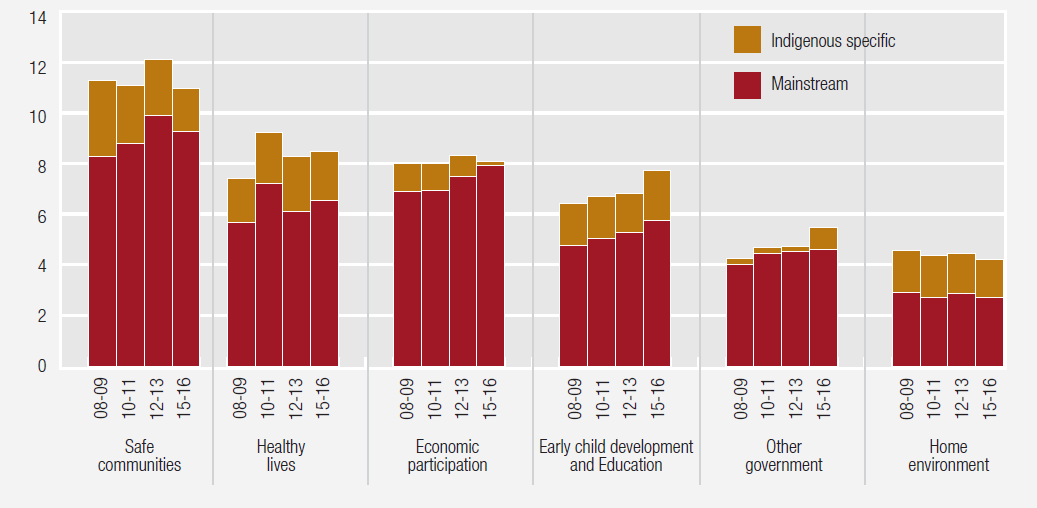
In 2015-16, expenditure per person for Aboriginal and Torres Strait Islander Australians was highest for safe and supportive communities ($10 948) and lowest for home environment ($4197). Expenditure on healthy lives, early childhood and education and other government services have shown upward trends since 2008-09, while there has been a decrease for safe communities and for home environment (reflecting a decrease in Indigenous specific expenditure). Expenditure for economic participation has remained relatively stable. (Figure 1).
Figure 1: Expenditure on Aboriginal and Torres Strait Islander Australians, by building block and type of expenditure, by yeara, b
Real $’000/person

a Includes Australian, State and Territory governments direct expenditure.
b Expenditure data adjusted in real terms to 2015-16 dollars.
Source: 2017 Indigenous Expenditure Report, tables W2, W4, W6, W8.
What were the estimates by State and Territory?
Expenditure is also disaggregated across the eight States and Territories, including between Australian, State and Territory governments. It is important to note when referring to direct expenditure, that to avoid double-counting, transfers by the Australian Government to State/Territory Governments (indirect expenditure, as it goes to State and Territory Governments who then spend) is counted as part of the State/Territory Government direct expenditure (and not counted under the Australian Government). Total expenditure by the Australian Government (ie, direct and indirect expenditure) is available in the data tables on the 2017 IER web page.
The Australian Government accounted for $14.7 billion (43.9 per cent) of direct Indigenous expenditure in 2015-16, a real increase of $2.2 billion (17.5 per cent) from 2008-09. The remaining $18.8 billion (56.1 per cent) was provided by State and Territory governments, a real increase of $4.3 billion (29.7 per cent) from 2008-09.
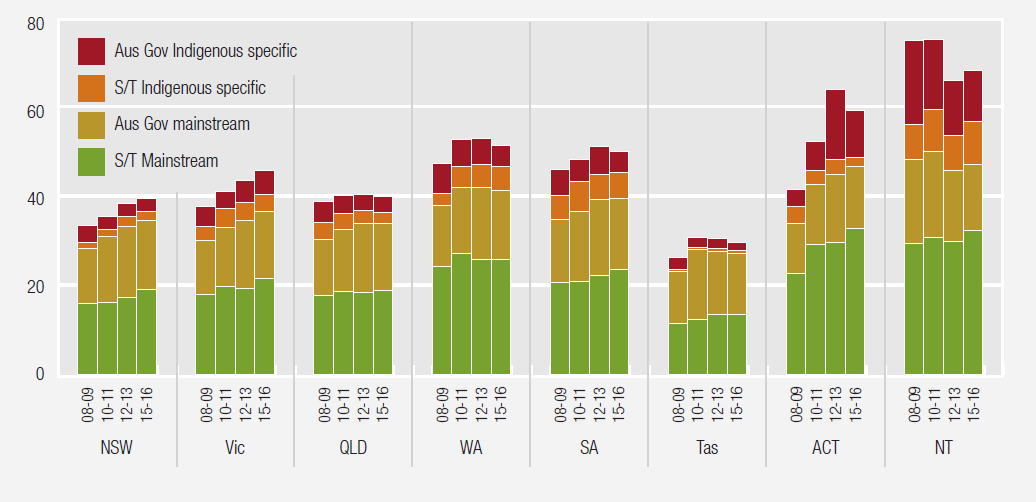
In 2015-16, expenditure per person for Aboriginal and Torres Strait Islander Australians was highest in the Northern Territory ($68 186) and lowest in Tasmania ($29 602) (figure 2).
Figure 2: Expenditure on Aboriginal and Torres Strait Islander Australians, by type of expenditure and level of government, by state and territory, by yeara, b
Real $’000/person

a Includes Australian, State and Territory governments direct expenditure.
b Expenditure data adjusted in real terms to 2015-16 dollars.
Source: 2017 Indigenous Expenditure Report database (All government direct real table; tables P.1 and P.2).
Where can I find the estimates I want?
Data are presented on the 2017 IER web page in three formats.
Overview data
- 24 standard tables (pre-formatted) available in Microsoft Excel and PDF format. The tables provide high level estimates for 2008-09, 2010-11, 2012-13 and 2015-16 for expenditure and expenditure per person, adjusted for inflation.
Pivot tables (more detailed data)
- Six Excel workbooks are provided with a pivot table interface (each workbook has instructions for use)
- Using the pivot tables, it is possible to see the most detailed level of data for all reported expenditure codes. Users can also create their own custom pivot tables.
Advanced database
- An unformatted comma separated values (CSV) file for users who wish to analyse the data using their own preferred statistical software.
For more information…
The following are available from the 2017 IER web page:
- A short video on how to access the 2017 IER data from the different formats.
- The IER report and caveats to assist with interpretation of the data.
- The IER manuals for detailed information on the method for deriving IER estimates.
The IER is produced by the Productivity Commission for the Steering Committee for the Review of Government Service Provision.
For more information complete general enquiry form
Indigenous Expenditure Report 2017
- Read the Report released October 2017