PC productivity bulletin 2019
This bulletin was released on 4 June 2019. As with previous Productivity Updates, the 2019 Productivity Bulletin unpacks and analyses the latest Australian Bureau of Statistics (ABS) productivity statistics, and details and comments on trends and new developments underlying Australia's recent productivity performance.
Download the bulletin
- Productivity at a glance
- Infographic
- Supporting data

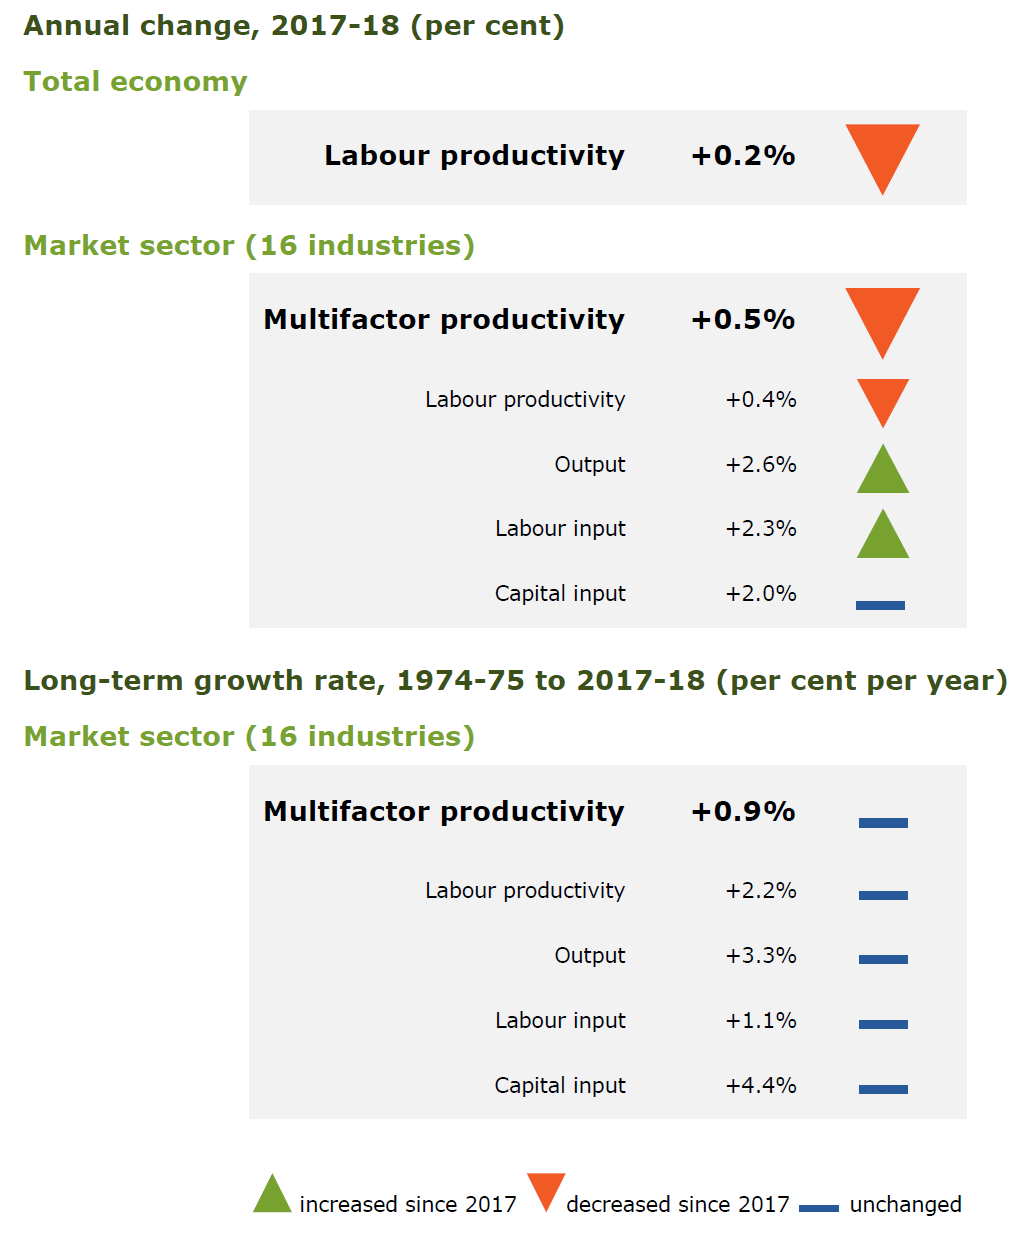
Annual change, 2017-18 (per cent) (Text version of above image)
Total economy
Labour productivity +0.2%
Market sector (16 industries)
Multifactor productivity +0.5%
Labour productivity +0.4%
Output +2.6%
Labour input +2.3%
Capital input +2.0%
Long-term growth rate, 1974-75 to 2017-18 (per cent per year)
Market sector (16 industries)
Multifactor productivity +0.9%
Labour productivity +2.2%
Output +3.3%
Labour input +1.1%
Capital input +4.4%
Sources: Commission estimates based on: ABS (2018, Australian System of National Accounts, 2017-18, Cat. no. 5204.0); ABS (2018, Estimates of Industry Multifactor Productivity, 2017-18, Cat. no. 5260.0.55.002); ABS (2018, Labour Force, Australia, Sep 2018, Cat no. 6202.0); and ABS (unpublished data).
Download the infographic

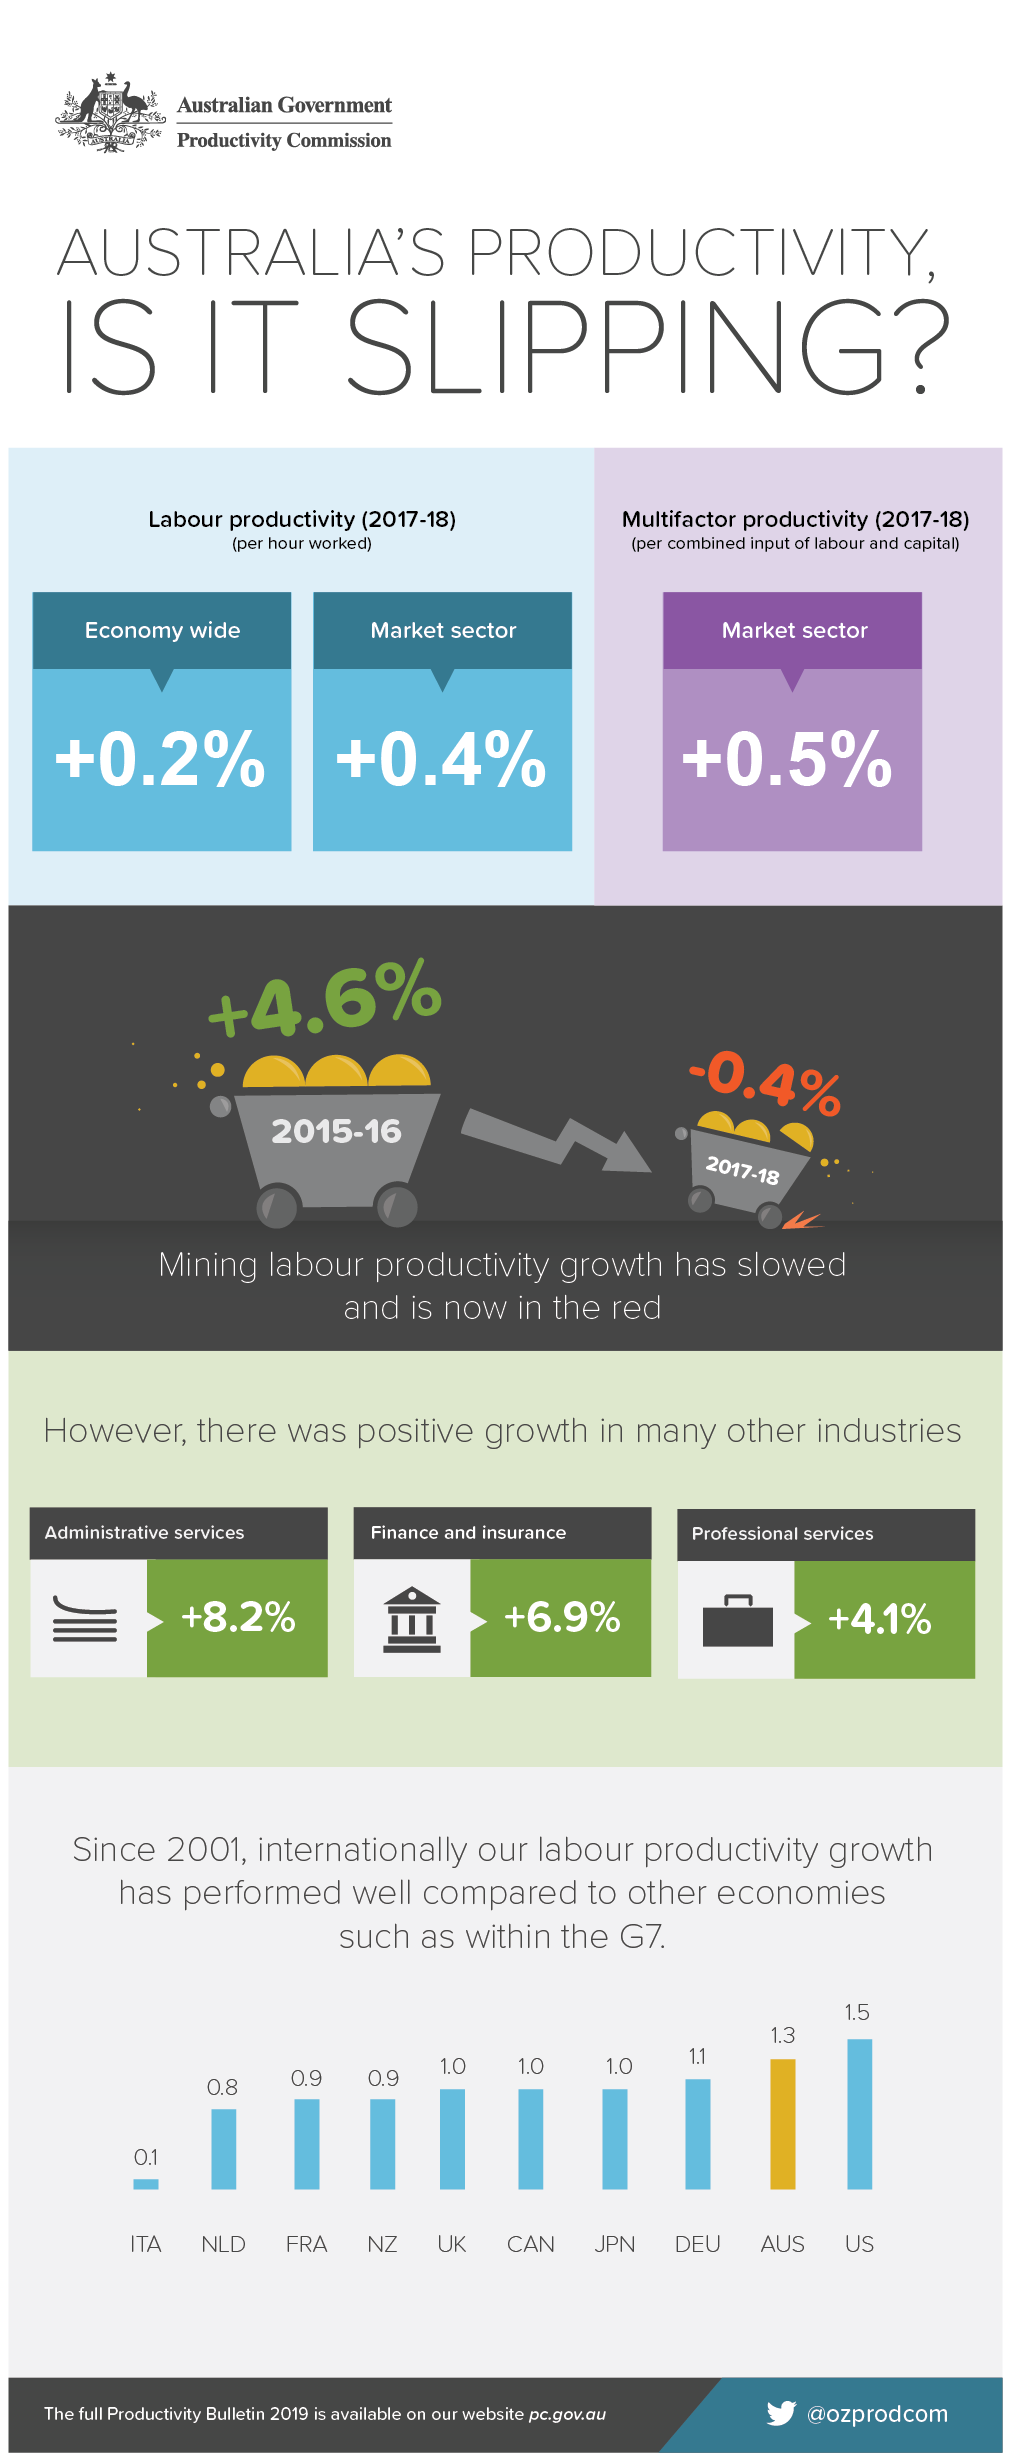
Australia's productivity, is it slipping? (Text version of the infographic)
Labour productivity (2017-18)
(per hours worked)
- Economy wide +0.2%
- Market sector +0.4%
Multifactor productivity (2017-18)
(per combined input of labour and capital)
- Market sector +0.5%
Mining labour productivity growth has slowed and is now in the red
- +4.6 in 2015-16 to -0.4% in 2017-18
However, there was positive growth in many other industries
| Administratitive services | +8.2% |
|---|---|
| Finance and insurance | +6.9% |
| Professional services | +4.1% |
Since 2001, internationally our labour productivity growth has performed well compared to other economies such as within the G7.
| Italy | +0.1% |
|---|---|
| The Netherlands | +0.8% |
| France | +0.9% |
| New Zealand | +0.9% |
| United Kingdom | +1.0% |
| Canada | +1.0% |
| Japan | +1.0% |
| Germany | +1.1% |
| Australia | +1.3% |
| United States | +1.5% |
More detail can be found in the full PC Productivity Bulletin.
The following excel file contains tables of data used to make the charts within this report.